Modeling Collegiate Basketball Player Impact
Collegiate Adjusted Regularized Contribution is a transparent college basketball impact metric that blends possession-level production with on-court impact
Executive Summary
Adjusted Regularized Contribution (ARC), is an NBA player impact metric developed under the Luma framework(paper coming soon) to describe and quantify realized player impact granularly possession by possession. ARC combines possession-weighted production with a box priored regularized adjusted plus minus (RAPM) to identify the players who contribute most to winning on a possession basis.
ARC is built on the philosophical understanding that player value is both captured and missed by production-based metrics and by impact-based metrics alike, and that combining the two in a mathematically effective way gives an extremely robust, comprehensive description of a player's value in a given season.
While extremely effective in quantifying the best players in the NBA, it cannot be copied over one-to-one to the world of collegiate basketball
The college game has structural characteristics that make player impact harder to describe numerically:
- shorter seasons,
- tighter and more rigid lineup samples,
- diffused talent density,
- dramatic schedule variation
- and extreme roster turnover
C-ARC, or College ARC, adapts the ARC framework to those constraints. It combines two value components, a possession-weighted production component and an opponent-adjusted on-court impact component, and serves them alongside a separate schedule-strength layer that separates estimated value from the competitive confidence of the environment where that value was produced.
C-ARC is not a draft projection model or the final answer to player evaluation. Rather, a first step toward transparent evidence of possession-by-possession impact in college basketball.
Difficulties of modeling Collegiate player impact
College game is historically notoriously harder to make effective impact metrics due to the following reasons:
Sourcing of Lineup Data,
The primary way to measure impact in basketball is through some derivative of an on/off split. The contemporary approach is to calculate a regularized adjusted plus-minus, using as much lineup data as possible in the regression and mathematically solving for the point differential when an individual player is on the floor.
To create these metrics, you need clean lineup data:
* exact substitution events
* time on court
* exact 10-man combinations
* exact possession outcomes
In the collegiate game this data is frequently incomplete, inconsistently standardized across programs, and in many cases held behind paywalls. Many mid-major and even high major programs lack the advanced tracking, and clean play by play, to say nothing of Division II and III, and there exists no standardized, normalized approach to measuring box scores, advanced box scores, or impact across the full breadth of collegiate basketball. For this reason, the present paper restricts itself to Division I, and to the high-majors in particular, where the data is most complete.
Sample Size
And you need this data in abundance. Even with 82 games and over 5,000 possessions per player in the NBA, metrics like RPMs are often served with multi-year weighting to help offset collinearity (players sharing so many minutes together that individual effects are hard to separate) and small, unstable samples. In contrast, the NCAA basketball season is only 30 games, high-end starters who play 30 minutes a night will only max out at about 900 minutes and roughly 1,500 possessions , 70% lower.
In addition, college lineups are far tighter and more rigid, with starters routinely playing 80% or more of the entire game. A Division I team uses only about 78 unique five-man lineups a season versus roughly 510 in the NBA and even after you adjust for fewer games and slower pace, the NBA still generates nearly twice the lineup variety per possession.
Roster Turnover
Men's College basketball is inherently a talent pipeline for the NBA as a result, the best players and prospects often don't play more than one or two seasons. Even among the talent that does stay in college for more of their four-year allotment, in the age of NIL there's an incredible amount of turnover from season to season. The best players/prospects are constantly cycling in and outof the pool, and multi-year weighting can't rescue the sample the way it can in the NBA as the data want to construct it isnt there.
Any impact metric that heavily relies on on/off metrics will be extremely noisy and with face mathematical difficulty to separate the individual from their team and line-up environment.
Talent Density
Impact metrics such as RAPM, EPM, and DARKO, while accounting for differences in the opponent quality relative to the league, do not account for a difference in the competitive environment itself. They assume every player is operating inside the same band of competition, that every team is more or less playing the same level of basketball. Thus they derive an incredible amount of value in the NBA, where the players occupying those roughly 500 roster spots compete against the same 99th-percentile talent every night. Collegiate basketball offers no such consistency.
As an extreme example: a top prospect might face a mid-major opponent with zero NBA talent on the floor one night, then turn around and play in the SEC the following week against players much closer to NBA athleticism and NBA size. In addition, in any given draft class, there are players at mid-majors and in less competitive conferences who genuinely possess NBA talent.
Schedule Disparity / No common opponents
In the NBA Every team plays every other team multiple times, so every player, especially over a multi-year sample, is measured against a common, connected web of competition. In College Basketball a player plays roughly 30 games out of more than 300 Division I teams, and every year hundreds of players finish a season without having faced one another even once.
Taken together, Functionally, one player can face a competitive context of several magnitudes of dificulty higher more difficult than another's, with no common slate to bridge the gap between them.
The question then becomes:
how do you fairly normalize production across tangibly different competitive contexts?
The College Basketball Impact Framework (CBIF)
As a result of the aforementioned constraints of the collegiate game, a college basketball impact/value metric, must:
* Reconstruct team winning (a player's value should represent his share of his team's net rating, such that the minutes-weighted values of a roster sum back to the team's actual performance).
* Adjust for opponent strength.
* Account for schedule connectivity.
* Survive a single-season sample. With an added bonus for being decomposable so a rating can be pulled apart into production and impact, offense and defense, rather than read as one opaque number.
Where Current Metrics Fall Short
As with the NBA, collegiate basketball is blessed with a plethora of stats that have done a great job of capturing latent player value. Not all of them, though, meet the aforementioned framework, and thus should not be relied on moving forward.
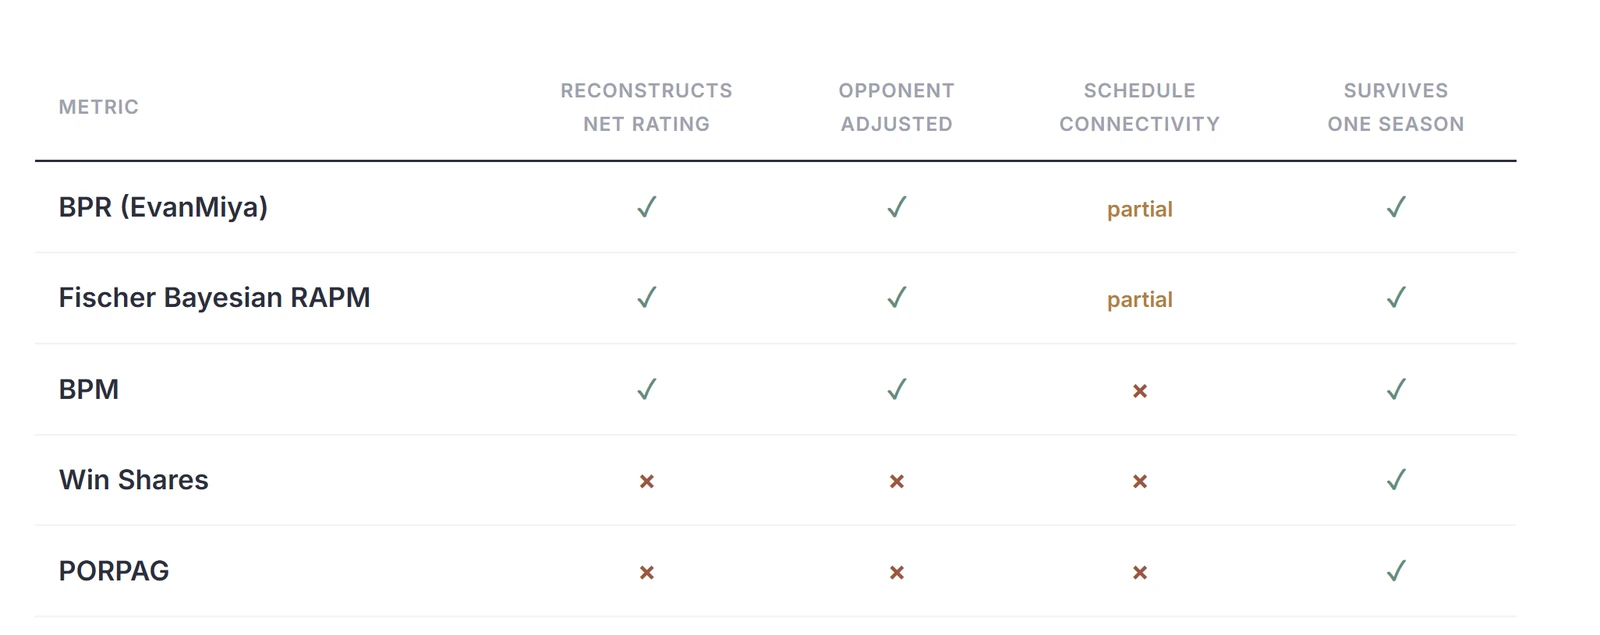
BPM, PORPAG, and Win Shares are among the box-score-centered metrics currently dominating college basketball's statistical discourse. They're accessible stable, and easily computable for every player, with data that runs back decades. They also sidestep a lot of the harder parts of measuring collegiate impact, like collinearity, sparse lineup data, and tiny samples, because they don't account for on-floor impact at all. PORPAG and Win Shares specially fail frame 1 of reconstructing team net rating.
A quick aside on team net rating reconstruction. For all the abstraction we compile on, for all the extraction that comes with describing player value, that value should ultimately reconstruct to something tangible. You cannot create value out of thin air. With the game of basketball producing a fixed result, value has to be defined as a player's ability to influence that margin. This gives value a zero-sum nature. There is a set amount of value that can exist across a league in any given season, and for one player to be deemed valuable, another has to be deemed invaluable Having an anchor to reconstruct to helps to make sure value is not procured from nowhere and gives insight if the stats is actually capturing what positively influences the end goal of basketball: that being winning games. Thought exercise: If a stat calculates that a team is full of impactful players, that team should, in real life, have elite results. And vice versa: if a stat finds a team is not full of impactful players, that team should have poor results Team net rating is what this framework chooses as the target. It is what any reconstruction, at least in this context, should be aimed at. It is a tangible, clean, objective read of how well a team actually performed in a given year, it is comparable across every team in the country, and it is automatically relative between seasons and eras. (Team net rating is the difference between a team's points scored and points allowed per 100 possessions.)
PORPAG fails as it is designed to reconstruct team offense alone, with no defensive component. Win Shares attempts to reconstruct wins, which I posit is an unstable derivative of team net rating, contaminated by luck. Both reconstruct team net rating less cleanly than a properly anchored metric should, at R² 0.52 and 0.67 respectively, well short of ARC's 0.96 (more on this, with more numbers, in the validation section).
Both PORPAG and Win Shares also fail to adjust for the variance in the competitive environment. BPM does account for schedule strength, but only through a single team-wide constant. C-ARC's adjustment is applied at the player level, weighting each player's production by the specific opponents he shared the floor with.
BPM retains real usefulness because of how it is built: regressing box-score statistics against a large RAPM sample to recover the relationship between box-score components and on-court impact. For that reason it reconstructs team net rating exceptionally well. (More on that in our validaion section) Its one structural limit is that it only ever sees the box score
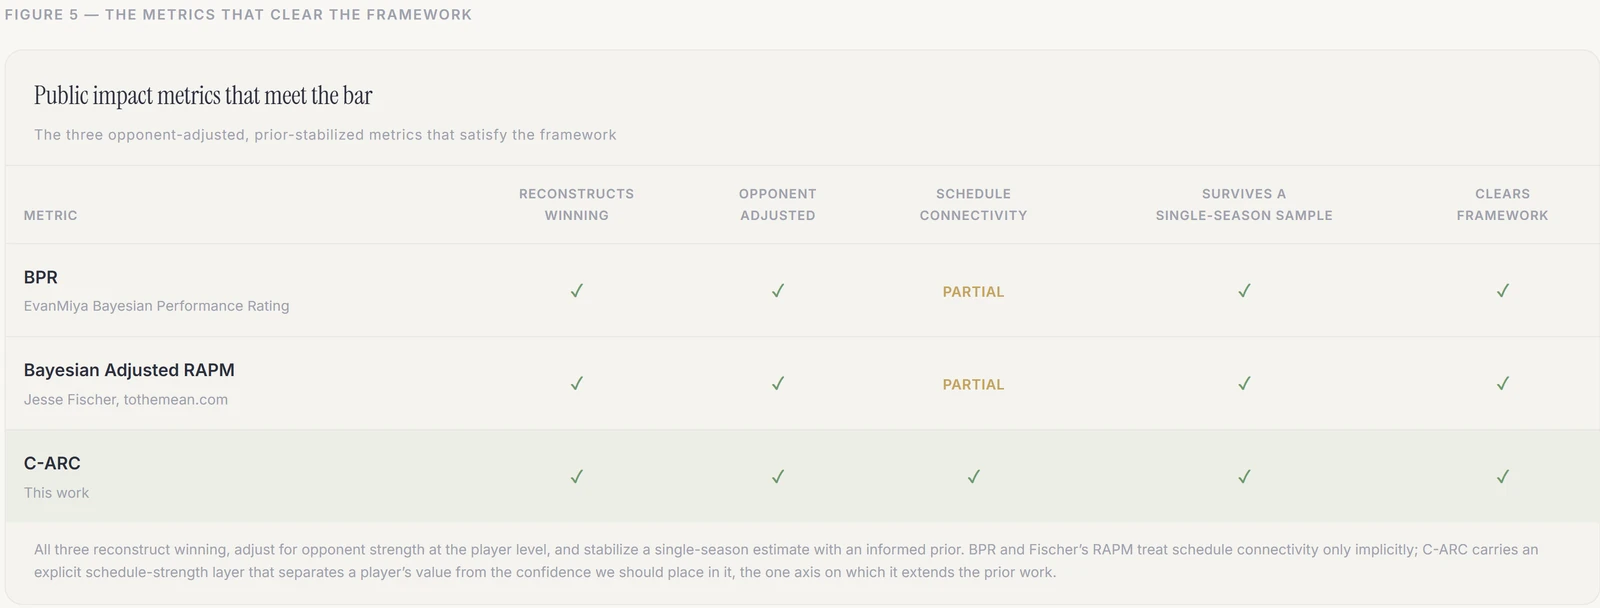
The Metrics that pass the bar
While researching and building ARC, I had the privilege to read and learn form a couple metrics and methodologies that align with the college basketball impact framework. They served as a great barometer for constructing ARC. Evan Miya's Bayesian Performance Rating (Evan Miyakawa), stands as an extremely robust robust public impact metric.
BPR estimates a player's offensive and defensive value on a per-possession basis, expressed as points per 100 possessions above the Division I average. It is constructed by fusing three models within a single Bayesian framework:
- a regularized adjusted plus-minus model that measures on-court impact,
- a box-score model that serves as a stabilizing prior,
- and a preseason projection model informed by prior performance and recruiting profile. (Incredibly unique and intriguing.
Critically, it adjusts for the strength of both teammates and opponents at the possession level, the most granular form of competitive adjustment available.
Jesse Fischer's Bayesian Adjusted RAPM (tothemean.com) stands equally as yoked as a public collegiate impact metric, and is the work we modeled the impact side of ARC on.
His Bayesian Adjusted RAPM estimates a player's on-court impact through a RAPM regressed toward an blended prior: a team component built from a player's team relative strength, his minutes and minute weight, and his share of a box-score prior drawn from his per-possession production.
It provided much of the groundwork for the RAPM portion of ARC's blend. His work provided much of the initial validation for the RAPM portion of ARC's blend, which independently arrived at an extremely similar solution to schedule disparity and stabilization problems.
Introducing Collegiate Adjusted Regularized Contribution (C-ARC V1.0)
C-ARC is a college basketball impact metric built to satisfy the College Basketball Impact Framework and, in doing so, to better handle the constraints and difficulty of modeling player impact in the collegiate game. It describes and quantifies a player's realized contribution to winning on a possession-by-possession basis.
C-ARC is expressed in points per 100 possessions relative to an average Division I player, combining a player's tangible per-possession production with his measured on-court impact.
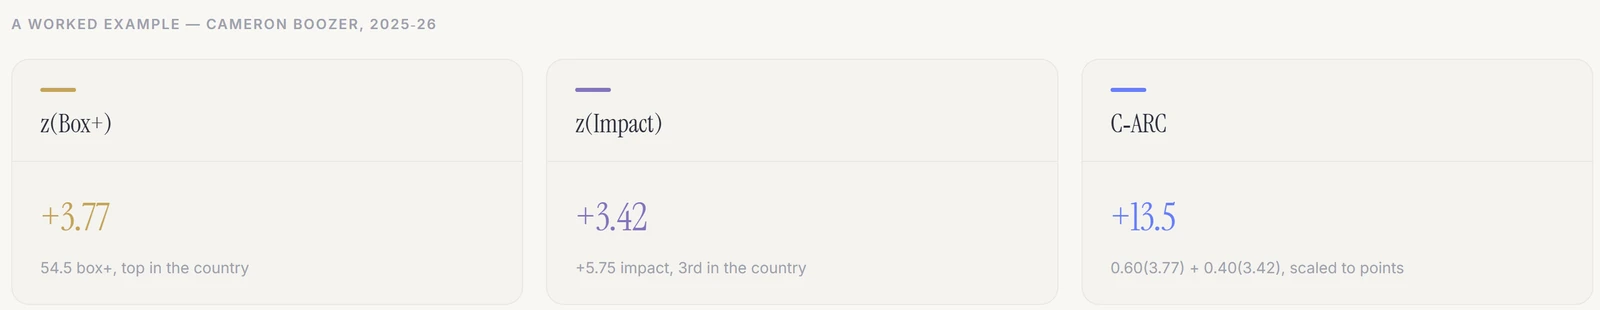
A C-ARC of 0 is league average. Cameron Boozer's +13.5 means he contributes roughly 13.5 points per 100 possessions of value beyond what an average Division I player would, combining his tangible production per possession with his on-court impact.
C-ARC's value is built by blending two components: an opponent-adjusted, possession-weighted production component, and a box-prior-informed regularized adjusted plus-minus (RAPM). Alongside the value, C-ARC carries a separate schedule-strength layer. Served as a contextual number about the competitive environment in which the C-ARC value was produced.
It is not a draft projection model or the final answer to player evaluation. It is a first step toward transparent, decomposable evidence of possession-by-possession impact in college basketball.
Adjusted C-Box+
OvERVIEW
This is the foundation of C-ARC. It provides a strong, tangible, objective floor of a player's contributed value on a possession-by-possession basis, making it safe and stable to layer on the added abstraction that comes with a regularized adjusted plus-minus.
Adjusted C-Box quantifies the tangible value a player produces on a possession-by-possession basis, expressed in points per 100 possessions and weighted by the strength of the competition he faced. It takes the average value of a collegiate possession and decomposes it into the distinct box-score actions that make it up. Each box action is assigned a value reflecting its actual worth on the floor, and those values are summed into a single number per 100 possessions.
Answering the question: For every 100 possessions a player is on the court, how much is he tangibly contributing?
Technical Details
C-Box+ was constructed the same way as its NBA equivalent.
The model was fit over 11,000 collegiate team-games, regressing team scoring on the rate of each box action per 100 possessions, and explaining team output at an R² of 0.82. From that regression, the average value of a collegiate possession was found to be 1.09, roughly 7 percent lower compared to the NBA (1.18 PPP).
From there, the marginal value of every box action was revealed: a steal was found to be worth roughly +1.87 points, an offensive rebound +0.96, an assist +0.18, a block +0.35, and a turnover -0.86. Each player's actions are valued at these weights, expressed per 100 possessions, and summed into a single number.
The scale is centered so that 0 represents an average qualified player. Every point above or below zero reflects how much more, or less, value that player produced per 100 possessions.
The "plus" in C-Box+ is an inefficiency charge: a cost applied to empty scoring possessions. A made shot captures the value of the possession it ends; a missed shot consumes that possession without converting it. The charge debits a player for the possessions he spent without producing, so that two players with identical scoring output are separated by the efficiency with which they produced it.
Essentially, it ensures missed shots are faded proportionally.
An aside. This is an experiment I have been playing with since building the NBA equivalent of ARC, and it stems from a running idea that deserves its own paper(s): what, exactly, is a missed shot worth? There are a set number of possessions within a basketball game, and on any given possession a player can really only do one thing. You cannot get a steal and an offensive rebound on the same possession, or an assist and a steal. Those live on separate possessions, on separate ends of the floor. A missed field goal, then, is a possession spent by the entire team. Though it doesn't spell the end of a possessions like a turnover does, it can be offensive-rebounded, and the attempt itself carries some expected latent value. If an offensive rebound is worth roughly +0.96 on its own, a miss numerically, can sit somewhere between a turnover, the worst outcome at about -0.86, and a made field goal worth two or three points. Punish missed shots too harshly and a low-volume big who only shoots threes rates above a player carrying a heavier, more load-bearing shot diet. Ignore efficiency entirely and a player who scores the same amount, with the same defensive production, but at meaningfully worse efficiency, rates the same as the more efficient one. Neither is right. So the question I am still grappling with, and running numerical research on, is this: at what point does a missed shot become more valuable than not getting a shot off at all? I suspect the answer lives in the play-by-play itself, he cleanest path being a decomposition of the offensive rebound: how much of its value belongs to the rebounder and how much to the player whose missed shot created the chance in the first place?
C-Box+ addresses the schedule disparity constraint of the collegiate game by weighting each player's output by the strength of the opponents he faced, crediting production earned against strong competition more heavily than the same production against weaker competition.
This weighting is applied at the player level: using possession-level lineup data, C-Box+ measures the specific opponents each player shared the floor with and weights them by the time spent against each. As a result, two players on the same roster can be adjusted differently.
Collegiate Impact (C-Impact)
OvERVIEW
C-Impact is the on-court impact component of C-ARC. Where C-Box+ answers what an individual player is tangibly producing possession by possession, C-Impact answers a more abstract question: how much better does his team perform per 100 possessions when he is on the floor?
It is our implementation Regularized Adjusted Plus Minus (RAPM) a modify that has long been a primary method in contemporary advanced metrics for appraising player value. It captures much of the latent, intangible value the box score cannot, such as:
- rotations
- connectivity
- passing
- communication
- non-block rim protection
Technical Details
In the collegiate game, RAPM needs an abundance of samples and a great deal of care to properly isolate an individual, because the sample size simply is not there and the competitive environment is dramatically varied to normalize and standardize cleanly.
Quick Summary on how to build a RAPM: Like other proper implementations of RAPM, C-Impact was constructed from possession-level stints. Rather than relying on pre-aggregated lineup data, the season was reconstructed play by play, with lineups and substitutions rebuilt one by one from raw play-by-play data. Each unbroken stretch with the same ten players on the floor is a stint; a single game breaks down into roughly thirty of them. Across the 2025-26 season, computed over 384,000 stints across 6,317 games, each recording the players on both sides, the possessions, and the resulting margin, scaled to a per-100-possession basis. A ridge regression across every stint then solves for each player's individual effect on that margin, weighting longer stints more heavily and netting each player against both his teammates and his opponents. Detailed walkthrough: https://jeremiasengelmann.substack.com/p/nba-adjusted-plus-minus-how-to-build https://squared2020.com/2017/09/18/deep-dive-on-regularized-adjusted-plus-minus-ii-basic-application-to-2017-nba-data-with-r/
Whereas the NBA version of ARC and most public metrics lean on a box-score prior to stabilize the estimate, C-Impact anchors to relative team strength instead, a deliberate adaptation to the collegiate game. Because that prior is built from an opponent-adjusted team net rating, it also addresses schedule disparity from a second direction, inheriting the cross-conference adjustment baked into the rating.
The point of a prior in RAPM's is to give the regression a standardized, objective foundation before the added abstraction and noise of the data. Standard RAPM's starts every player at zero, assuming each is league-average until the on-court signal proves otherwise.
Which requires a great deal of data to become meaningful, and in the collegiate game, where there is considerably less of it, league-average may not be the most effective starting point for capturing player value.
C-Impact incorporates the relative strength of a player's team to better handle schedule disparity, anchoring each player to a baseline drawn from how good his team was and how much he played, an approach that, as noted earlier, parallels Fischer's Bayesian Adjusted RAPM.
In practice, a player's prior is a function of two quantities: the strength of his team and his share of its minutes. It takes the team's adjusted net rating, scales it to a per-player magnitude, and weighs it by playing time, so that a player only inherits his team's expectation to the degree that he was actually on the floor.
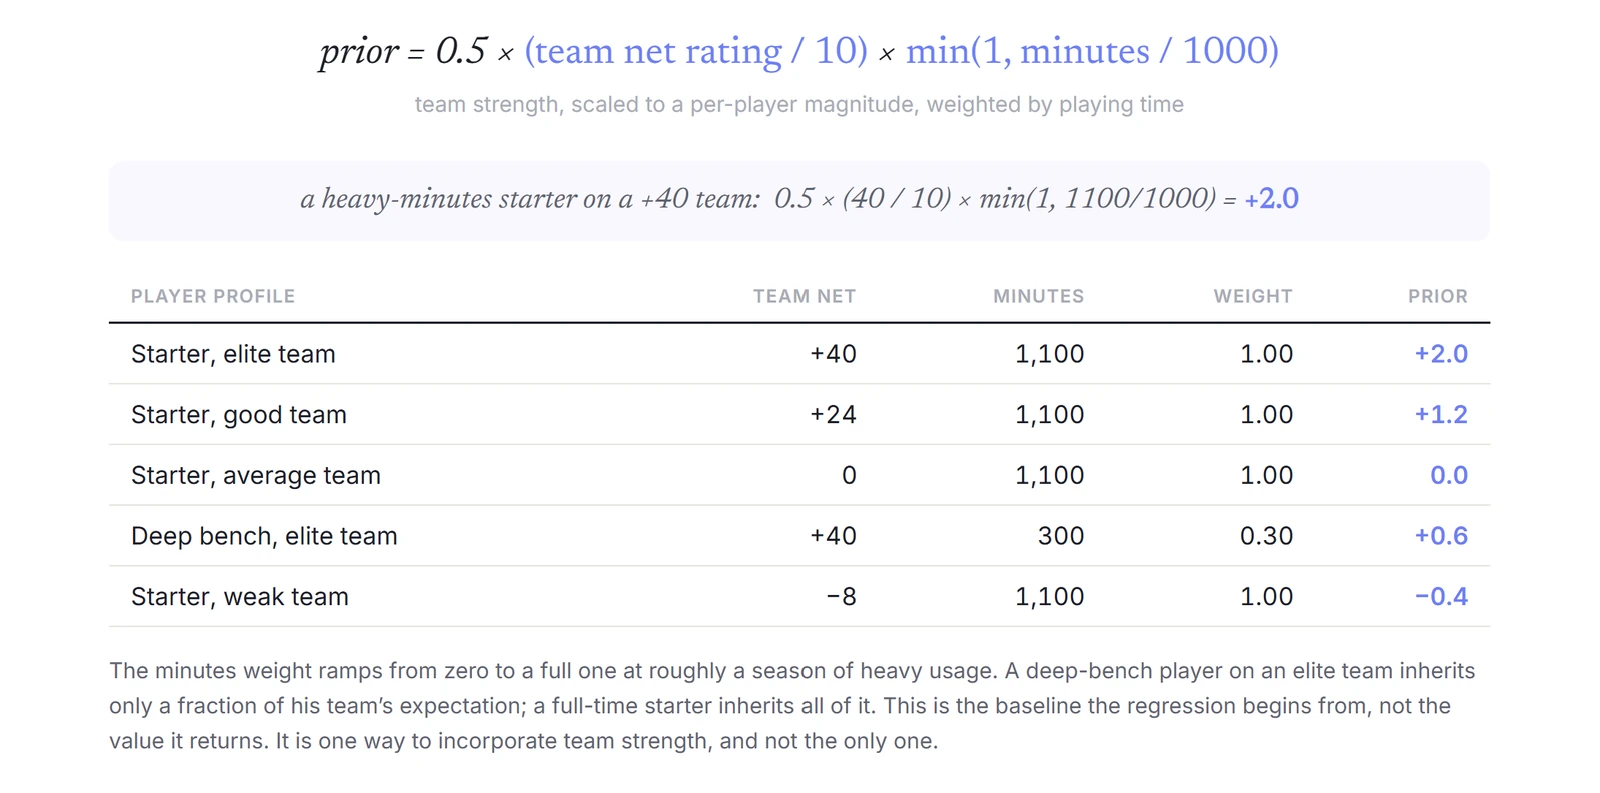
Consider a thought experiment. Take two players and hold every data point equal. One plays heavy minutes for a top-15 team; the other plays the same minutes for a worse-performing high-major. C-Impact will rate the first player slightly higher. As before any of the noisy, small-sample on-court data arrives, it is fair to assume that a high-minute player on a strong team is the better of the two.
C-Impact is therefore not fully team-agnostic, and the estimate, at least in version 1.0, relies a great deal on the adjusted team rating it anchors to. That rating, for now, is CBBD's adjusted net rating which already adjust for difference in talent across conferences.
The Blend: C-ARC
C-Box+ is a grounded, granular, possession-by-possession valuation of a player's tangible production, weighted by their strength of opponents. Like most box-centric metrics, it cannot see a lot of the intangible value created on the court, such as rotations, off-ball defense, and rim protection that doesn't end in a shot or a block.
It creates a strong foundation for the added abstraction of C-Impact, a schedule-adjusted, priored RAPM that measures on-court impact, a metric that on its own is far too noisy and unstable to stand as an all-in-one rating in the collegiate game.
The blending of the two individual components is Collegiate Adjusted Regularized Contribution, or C-ARC.
Both the NBA and collegiate versions of ARC were built with the philosophy that, with the current generation of basketball statistics, those derived from box scores and play-by-play rather than computer vision, the best way to measure a player's value is to blend his tangible production with his on-court impact.
Why Blend At All? (Philosophy Dump)
A possession in college basketball is worth roughly 1.09 points, and there are a limited amount in any given game. Within that fixed budget, a handful of events tangibly change the structure of a possession. A steal ends an opponent's possession and hands your team an advantageous one.A turnover does the reverse, surrendering an advantageous position to the other side.An offensive rebound extends your team's possession and creates a new advantageous one; a defensive rebound ends the opponent's. Layered on top are the acts of scoring themselves: the assist, the two, the three. At its core, basketball is a contest for the most advantageous position to put the ball in the basket. Someone has to move the ball, someone has to put it in the hoop, and someone has to make the physical action that creates that advantageous position. Each of those events has a measurable effect on a team's points per possession. But anchoring the foundation to tangible events is what keeps the metric scalable and honest. The best way to test a metric's validity is to push it to hypothetical extremes and edge cases. Grounding the rating in tangible events guards against the mythical glue guy: the player credited with enormous unseen value who never produces anything you can actually point to. The common example would be the low-usage, efficient big who happens to share the floor with high-scoring lineups, but whose impact, when dropped into a different environment or played alongside the bench unit, would not translate or scale. Practically, a single-yea r pure RAPM in 2017, with no adjustments, would rank Patrick Patterson among the ten best players in the league and Dante Exum inside the top fifteen. Collegiate, trusting single-season C-Impact alone, Arizona's Jaden Bradley would rank as the fourth-best player in the country and Florida's Boogie Fland inside the top fifteen, despite production that sits outside the top 240 nationally. These edge cases are more likely in collegiate basketball with far fewer possessions to smooth the noise, and less multi-year history to lean on. After C-Box+ bledning Bradley settles at 46th and Fland at 110th, far closer to who they actually are. The opposite extreme is guarded by the impact side. Capturing latent on-off value catches the inefficient, high-volume scorer whose entire offensive and defensive process hinders his team more than it helps. He may fill the box score with points, rebounds, and assists possession by possession, but his heliocentric, deeply inefficient style drags the team down in ways production alone will never reveal. Box production would reward him; impact catches him. NBA equivalent example being 2017 DeMar DeRozan. Both extremes are accounted for, and the result is the most complete and robust view of a player's possession-by-possession value that the aforementioned first-generation stats allow.
How It Blends
Box+ and Impact live on completely different scales. Box+ runs to about +50, while Impact tops out near +7. Box+ more directly denotes the points a player produces; Impact measures the difference his presence makes, the on‑off.
C‑ARC combines them cleanly by z‑scoring each one first — standardizing both to the same footing — and then blending them, weighted toward production:

The blend is box‑heavy, a deliberate 60/40 toward production. This inverts the NBA version of ARC, which leans on impact for the afforementioed reasons.
Keeping the two components separate and are blending only at the surface as most composite metrics do allows every rating remains fully decomposable. You can always see how much of a player's C‑ARC came from what he produced versus what his team did with him on the floor. And go even further and decompose both box plus, impact, and the blended arc into offensive and defensive breakdowns.
Even in its blended form, C-ARC does not fully solve schedule connectivity. I adjust for relative team strength using a pre-adjusted team net rating, but connectivity cannot be confidently called solved: there are gaps in the competition web, since not every team plays every other team in a season.
As an extra measure, I surface the schedule-strength layer as a view outside the blend, a separate axis of confidence. It does not alter the final C-ARC score; it adds another filterable, query able lever for contexts
Validation
This is the most formula- and table-dense part of the paper, and deliberately so. I want to give a brief shoutout to Ben, my partner and part of a research lab that hasn’t been named. He really helped ground me in tethering this stat to something real, being very granular and rigorous, and objectively testing it against the most used stats. I am very happy to announce that it stands extremely well and better than some stats at certain things.
Before any of it, a clarification of what C-ARC is. It describes the realized value of a collegiate player in a given season, intended to rank a player among his peers and to sit beside the box-score and impact stats already in daily use. It is not a draft projection or a forecast of what a player will become.
The validation moves through
- reconstruction,
- retrodiction,
- reliability,
- independence,
- convergence, and
- real-world outcomes, in that order.
Each is introduced where it begins. We start with reconstruction, because it is the most fundamental thing a value metric can be asked to do.
I. Reconstruction
Glossary — terms in this section Reconstruction Aggregating a metric's player values to the team level and comparing the result to the team's actual performance. Team net rating Points scored minus points allowed per 100 possessions, opponent-adjusted. The anchor reconstructed to. R²coefficient of determination The share of variance in the target a metric explains (0–1). Tracks whether teams are ordered correctly. Scale-invariant, so insufficient on its own. MAE (mean absolute error) The average size of the miss, in points per 100. Tracks whether the metric lands on the right magnitude. RMSE (root mean squared error) As MAE, but squares each miss before averaging, penalizing large errors more. A wide RMSE–MAE gap signals outliers. Slope The coefficient relating a metric's uncalibrated team sum to net rating. Near 1 means the values partition the margin. Ablation Removing a model's components one at a time to confirm how much each contributes. Here, rebuilding C-ARC layer by layer.
A metric is an added layer of abstraction, a tool for understanding some facet of the game more clearly. The danger in building one is getting lost in that abstraction until you are creating value out of thin air. The best metrics avoid this by tethering themselves to something real and objective, and asking how faithfully they can reconstruct it.
For a player-value metric, that real thing is team net rating. Net rating is, quite literally, the accumulation of how much every individual on the floor moves the team's margin; offensive and defensive impact are nothing more than a player's contribution to it. Decomposing a team's net rating into each player's share of it is therefore the natural move. Anything else is needless abstraction. It is also the cleanest target available: objective, a direct record of points for minus points allowed per 100 possessions; complete, capturing both ends of the floor where a scoring or offensive rating sees only half; and comparable, opponent-adjusted and placed on one scale across tempo, schedule, and season.
A lot of modern metrics try to predict RAPM, which is a fine target. RAPM, when done well, is an extremely effective regression that approximates how much a player affects his team's net rating. But it is still an estimate, and especially in the collegiate game, where there simply aren't enough samples, the volume of player-to-player and possession-to-possession data from season to season can get lossy quickly. C-ARC chooses team net rating as its North Star, going one level deeper. Not necessarily because it is better than trying to predict RAPM, but because, as the rest of this validation shows, it takes a different path to describing player value. Anchoring to net rating is also built to allow more granular analysis of the possession-by-possession value a player creates or loses.
A sound metric, then, should reassemble: the minutes-weighted sum of a roster's player values should land on its team's net rating.
Testing this has three parts — measuring how closely the values fit, confirming they genuinely sum rather than merely correlate, and checking that every layer of the metric earns its place.
The reconstruction battery
Each metric's player values are aggregated to the team level (minutes-weighted) and fit to team adjusted net rating, across two seasons and every qualified player.
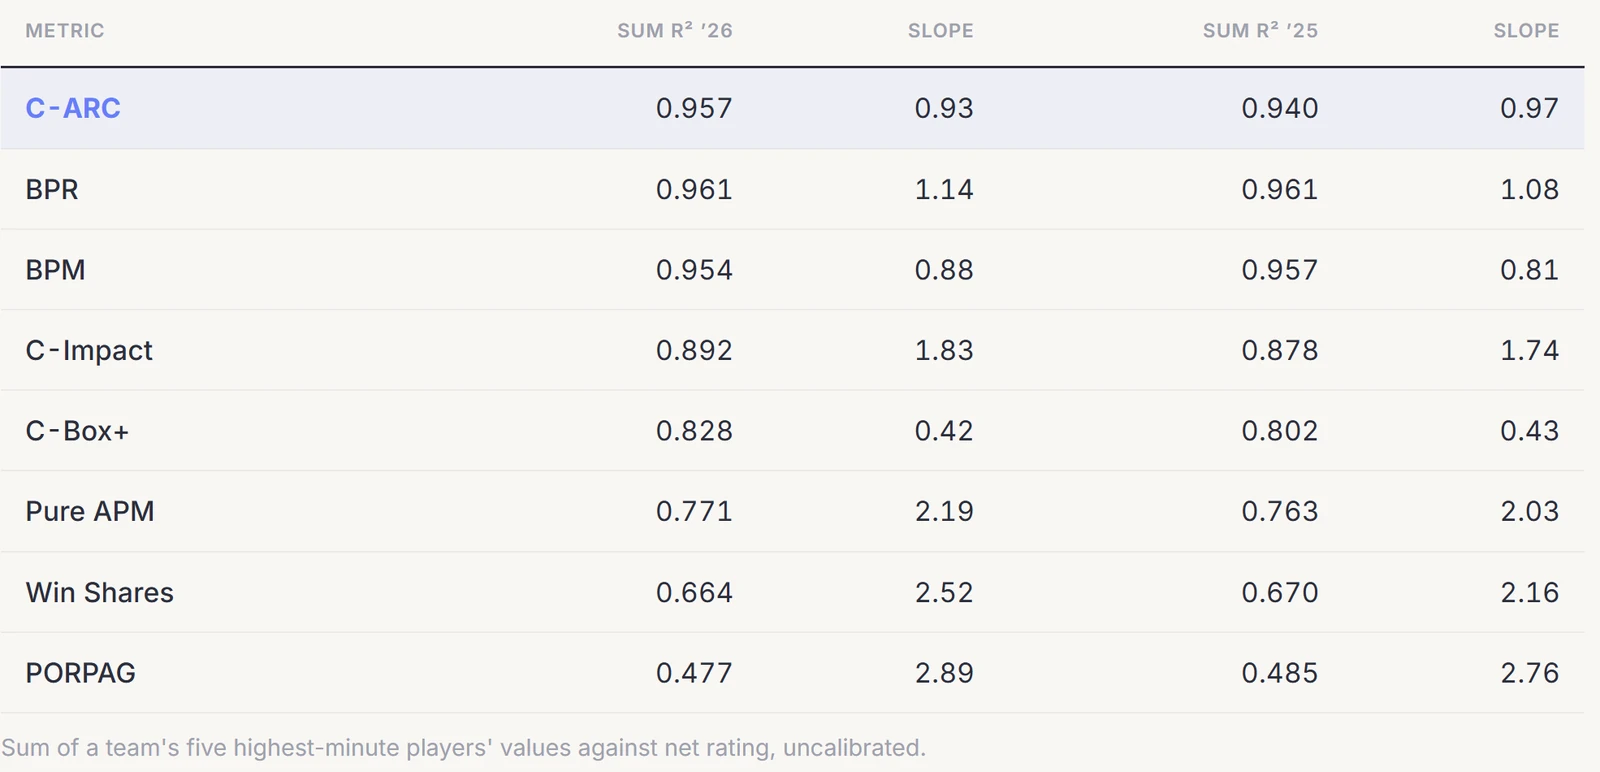
R² is a great introductory test for reconstruction, but it doesn't actually care about the size of the reconstructed numbers. One could theoretically multiply every player's rating by 10, or add 20 to each of them, and R² would stay exactly the same. The harder question for additive metrics is whether, if you literally reconstruct by adding up the team's players' ratings, you get the team's net rating. Not merely a correlation, but a summation.
If Duke's net rating is +40, then the summation of Duke's players' ratings should add up to about +40.
The slope of each metric's summed ratings against actual net rating measures this directly: the closer to 1, the "truer" the allocaiton.
C-ARC's slope is the closest to one of any metric here. To see why slope matters and R² alone does not, consider a deliberately broken control that hands every player his own team's net rating:

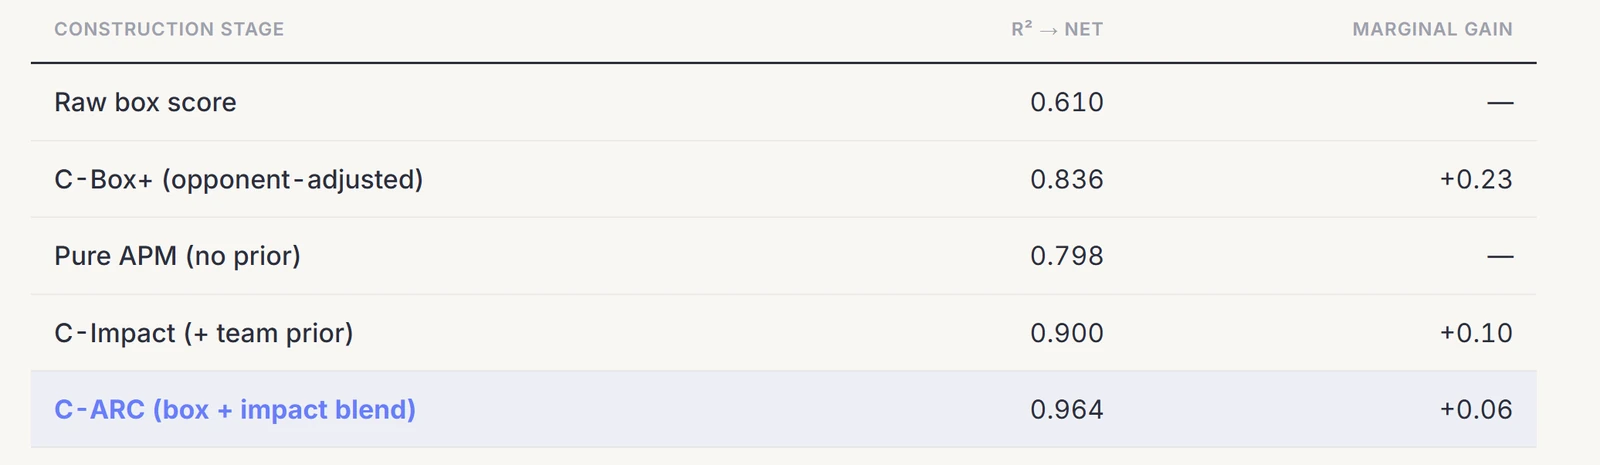
Another interesting thing while building C-Impact was the marginal value gain in reconstruction for each layer. Specifically, adding an opponent-adjusted slice to our C-Box+ gave us a whopping 0.23 in marginal gain for reconstruction. Also underscoring that the blend has real utility.
The intuitive instinct to pair what you can tangibly measure on a possession-by-possession basis with what you can only capture after running thousands of plays and stints makes for the best comprehensive capture of team net rating, or in other words, objective player value.
Retrodiction
Glossary — terms in this section Retrodiction Using one season's player ratings to predict the next season's team performance. An out-of-sample test: the rating is judged on data it never saw. Out-of-sample Evaluated on data outside what produced the rating. The opposite of reconstruction, which scores a metric on its own season. Replacement level The value assigned to a player with no prior-season rating (a freshman or transfer in), so every roster can be projected. Set at −2.0 for plus-minus metrics, 0 for counting stats. Roster continuity The share of a team's minutes returning from the prior season. Continuity alone predicts performance, so a metric's signal must be measured net of it.
I took each player's rating from one season, weighted it by the minutes he actually plays the next season, and used that to predict his new team's net rating.
C-ARC is descriptive; it is not engineered to predict. That it predicts relatively well anyway is evidence the underlying signal is real rather than fit to a single season's noise.
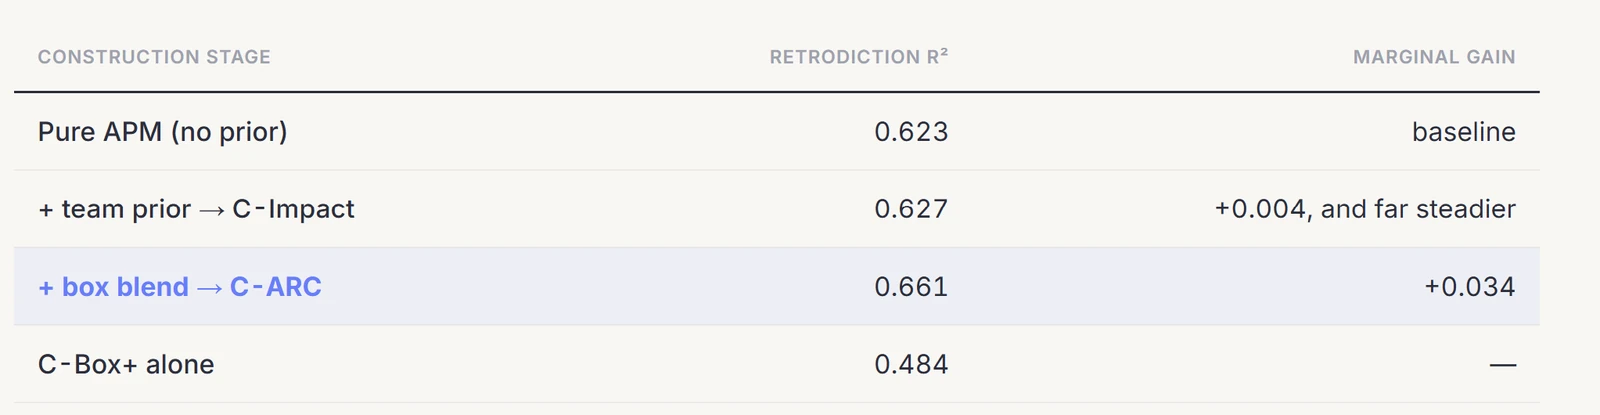
Every layer holds out of sample. Notably the prior adds little to the average but stabilizes it sharply: pure APM swings from 0.666 to 0.581 across the two pairs, and C-Box+ isolated, the most stable input, is the weakest predictor on its own.
Reliability
Glossary — terms in this section Reliability How consistently a metric rates the same player across separate measurements. A reliable metric captures a stable trait, not the noise of a single sample. Year-over-year stability The correlation between a player's rating in one season and his rating the next, among players who returned. Higher means the metric measures something durable.
Good metrics should rate the same player relatively consistently from one season to the next even accounting for edge case of rapid growth and declines.
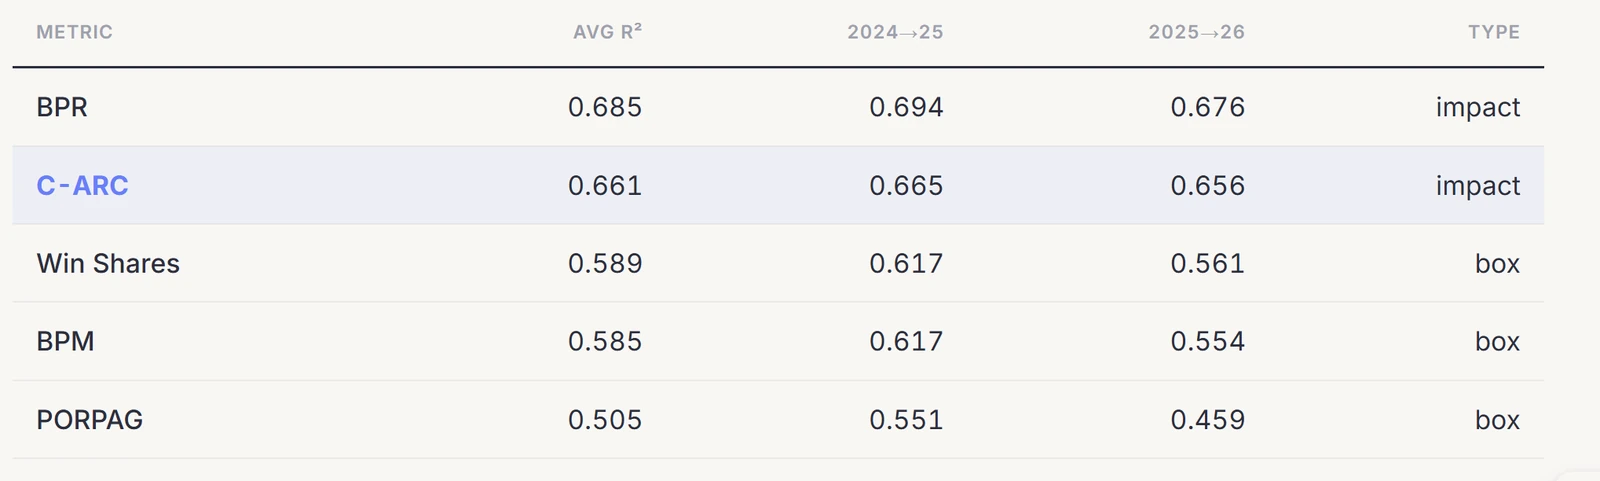
To check this, I correlated each returning player's rating in 2025 with his rating in 2026, for everyone who played at least 400 minutes in the first season.
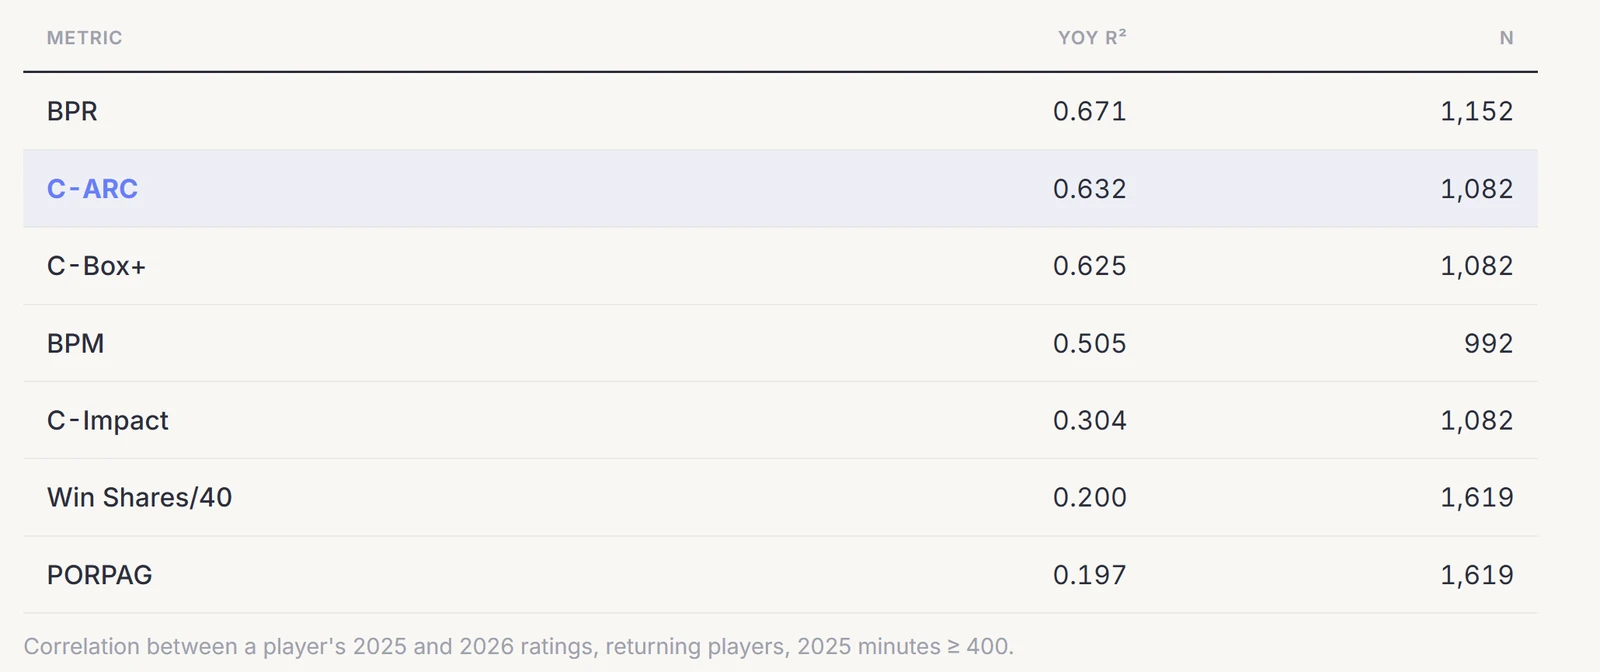
C-ARC repeats more reliably than every box-score metric, more than three times the stability of Win Shares or PORPAG and well ahead of BPM.
C-Impact having a .3 YOY R^2 is further proof that collegiate rapm (which is unpriored) is far to noisy and why C-ARC anchors it to the more stable C-Box+.
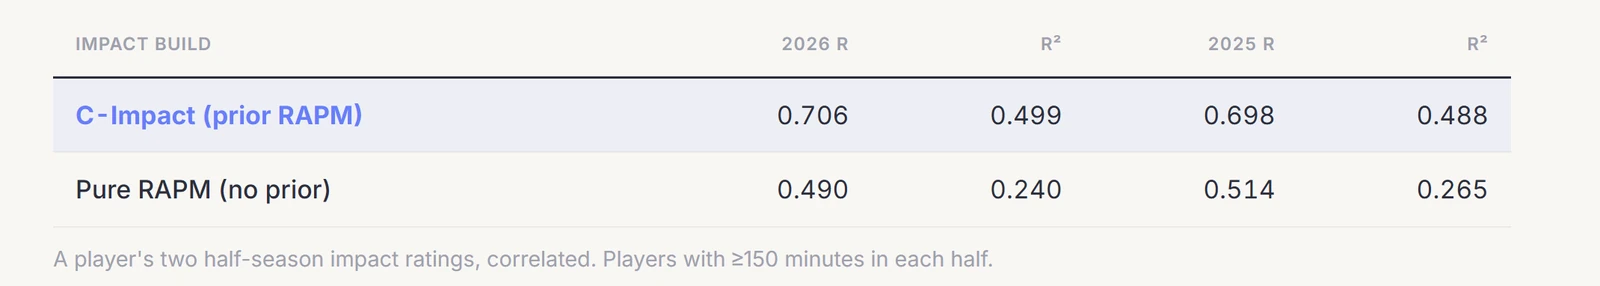
The stricter test: split-half
Instead of allowing the noise of transfers and player talent variance between seasons corrupt the end number instead split a single season's games in half, rate the player on each half, and correlate.
This requires recomputing a metric on half a season, which I cant easily do with BPM, Win Shares, PORPAG, BPR,etc as they only print their season totals rather than per game. Though it can be run on the component built from game-level data, and the noisiest one: C-ARC's impact.
Independence / Non - Circularity
Glossary — terms in this section Circularity When a metric reconstructs a target partly because that target was fed into it. A circular metric proves nothing; it is echoing its own input. Hold-out test Removing information for a subset of cases, then checking whether the metric still works on them. If it does, the result was not circular. Coefficient robustness How much a metric's rankings move when its internal weights are perturbed. A robust metric does not hinge on any single hand-set number. Rank correlation Agreement between two orderings of the same players (1.0 = identical order). Used here to compare a perturbed leaderboard to the original. C-Impact anchors each player to a prior built from his team's net rating, and C-ARC is then judged on how well it reconstructs that same team net rating. The obvious worry is circularity: is C-ARC reconstructing team strength only because team strength was baked into it? The honest way to answer is to take the prior away from some teams and see whether they still reconstruct.
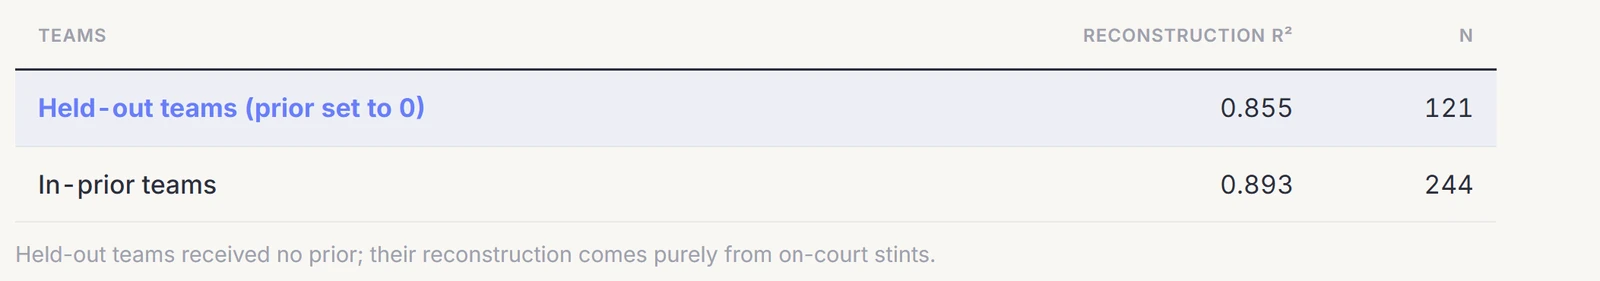
C-Box+ uses an opponent strength modifier and C-Impact anchors each player to a prior built from his team's net rating, and C-ARC is then judged on how well it reconstructs that same team net rating. The obvious worry is circularity: is C-ARC reconstructing team strength only because team strength was baked into it?
To test, I took away the prior from a third of teams and see whether they still reconstruct team net rating from the stint data alone.
Convergence vs other metrics
Glossary — terms in this section Convergent validity The degree to which a metric agrees with established metrics measuring the same thing. A new metric should land near the trusted ones. Discriminant validity The degree to which a metric stays distinct from metrics measuring something narrower or different. Agreement should not be so total that the metric is merely a copy. Rank correlation Agreement between two orderings of the same players, from −1 to 1. Here, how closely C-ARC's board matches another metric's.
I compared C-ARC's full board to each public metric by rank correlation, and counted how many of its top 50 each one shared.
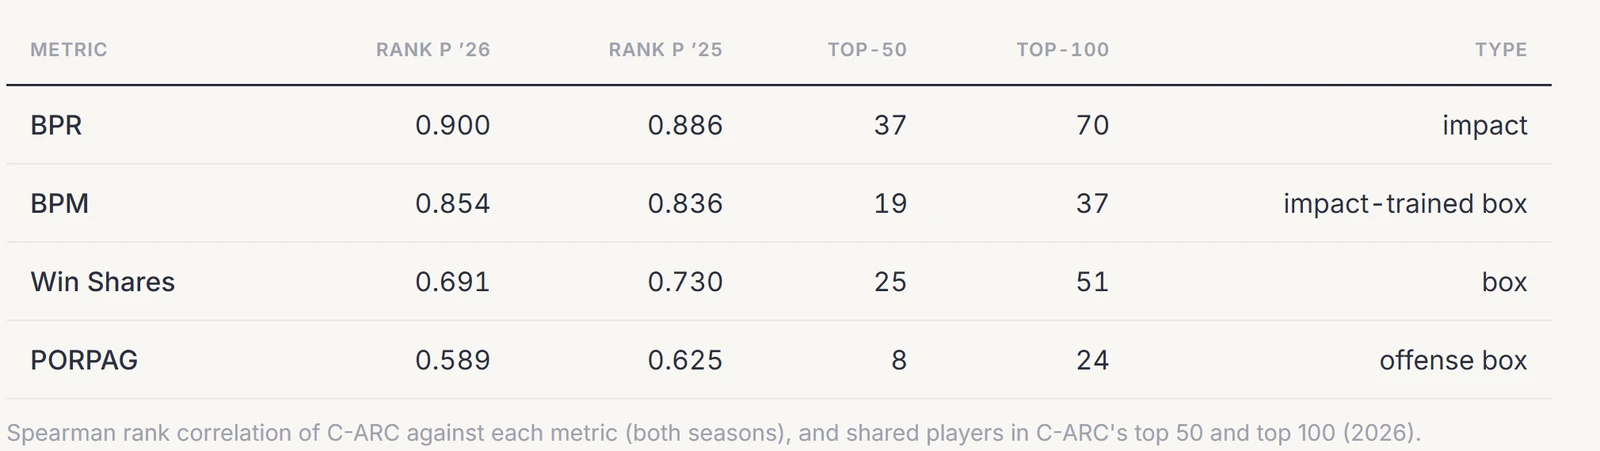
At the very top the two impact metrics converge outright: in 2026 C-ARC's top two, Cameron Boozer and Yaxel Lendeborg, are BPR's top two as well.
Framing and Caveats
C-ARC is a descriptive metric that aims to identify the most valuable players in a possession-by-possession context over a given season or segment of time. It is not a prediction or a projection.
Its philosophical foundation stands in slight contrast to much of advanced impact analytics today, where impact alone is held to be one of the truest measures of a player, and production is treated as an abstraction or a distraction from it. C-ARC is built on the understanding that impact and production are two sides of the same coin. They are different, inconclusive lenses, and only together do they give the most robust and comprehensive picture of a player's actual granular value.
Alone, each misses key parts of the game. A player can look deeply impactful through sample size, lineups, and circumstance while still relying on others to make the actions that numerically move the score. Others produce relentlessly, putting up empty-calorie stats that never lift their team's efficiency or make it more competitive, and in fact hinder it.
What is presented here is version 1.0 of C-ARC: a humble submission and the first public experiment in this philosophy of player-value evaluation. A lot will be changed and revised. This is open, and as the author I welcome any and all concerns, advice, and issues found.
Below are the caveats I flagged while working through this.
Caveats
The validation spans three seasons. C-Impact requires full play-by-play stint reconstruction, currently complete for 2024 through 2026. Results hold across those years, but a broader multi-year base is in progress and is the honest path toward calling the metric settled.
Single-season impact is noisy. Like every on-court model, C-Impact struggles to fully separate players who share most of their minutes and carries some of their team's quality with them. It is the central difficulty of the college game, and the reason C-ARC anchors impact to the stable box and a team prior rather than trusting it alone.
C-ARC is not team-agnostic. Its impact prior is built from team net rating, so identical on-court signals on different teams will not rate identically. The held-out test shows this is not circular, but it is real.
Every decomposition is still an experiment. Splitting value into offense and defense is more reliable on the production side, where it is directly observed, than on the impact side, where it is a noisier two-way regression best read as directional.
The efficiency charge is ongoing research. What a missed shot should cost, and how production should be discounted for inefficiency, is still an open question; the current value is a working one.
Schedule connectivity is flagged, not solved. A player on a near-disconnected mid-major schedule cannot be fully placed against the power conferences by any on-court method, so C-ARC surfaces a separate schedule-strength layer rather than pretend the rating carries equal confidence everywhere.