Introducing XPTS RAPM: XG for basketball (unfinished publish)
 𝑺𝒂𝒊𝒏𝒕🌹7 min read
Good day to you reader. I hope you are having a good day as you stumble upon this paper. My name is Ayo and, as much as I love basketball, I am Nigerian, thus soccer, or rather football is in my blood. Grew up playing it, studying it with my father.I routinely keep up with it through the Premier League and the UCL primarily and am currenlty really enjoying watching this World Cup with my father. If you tuned into any World Cup games this year, one of the things you'll see repeatedly on game summaries and even in missed games is expected goals per team.
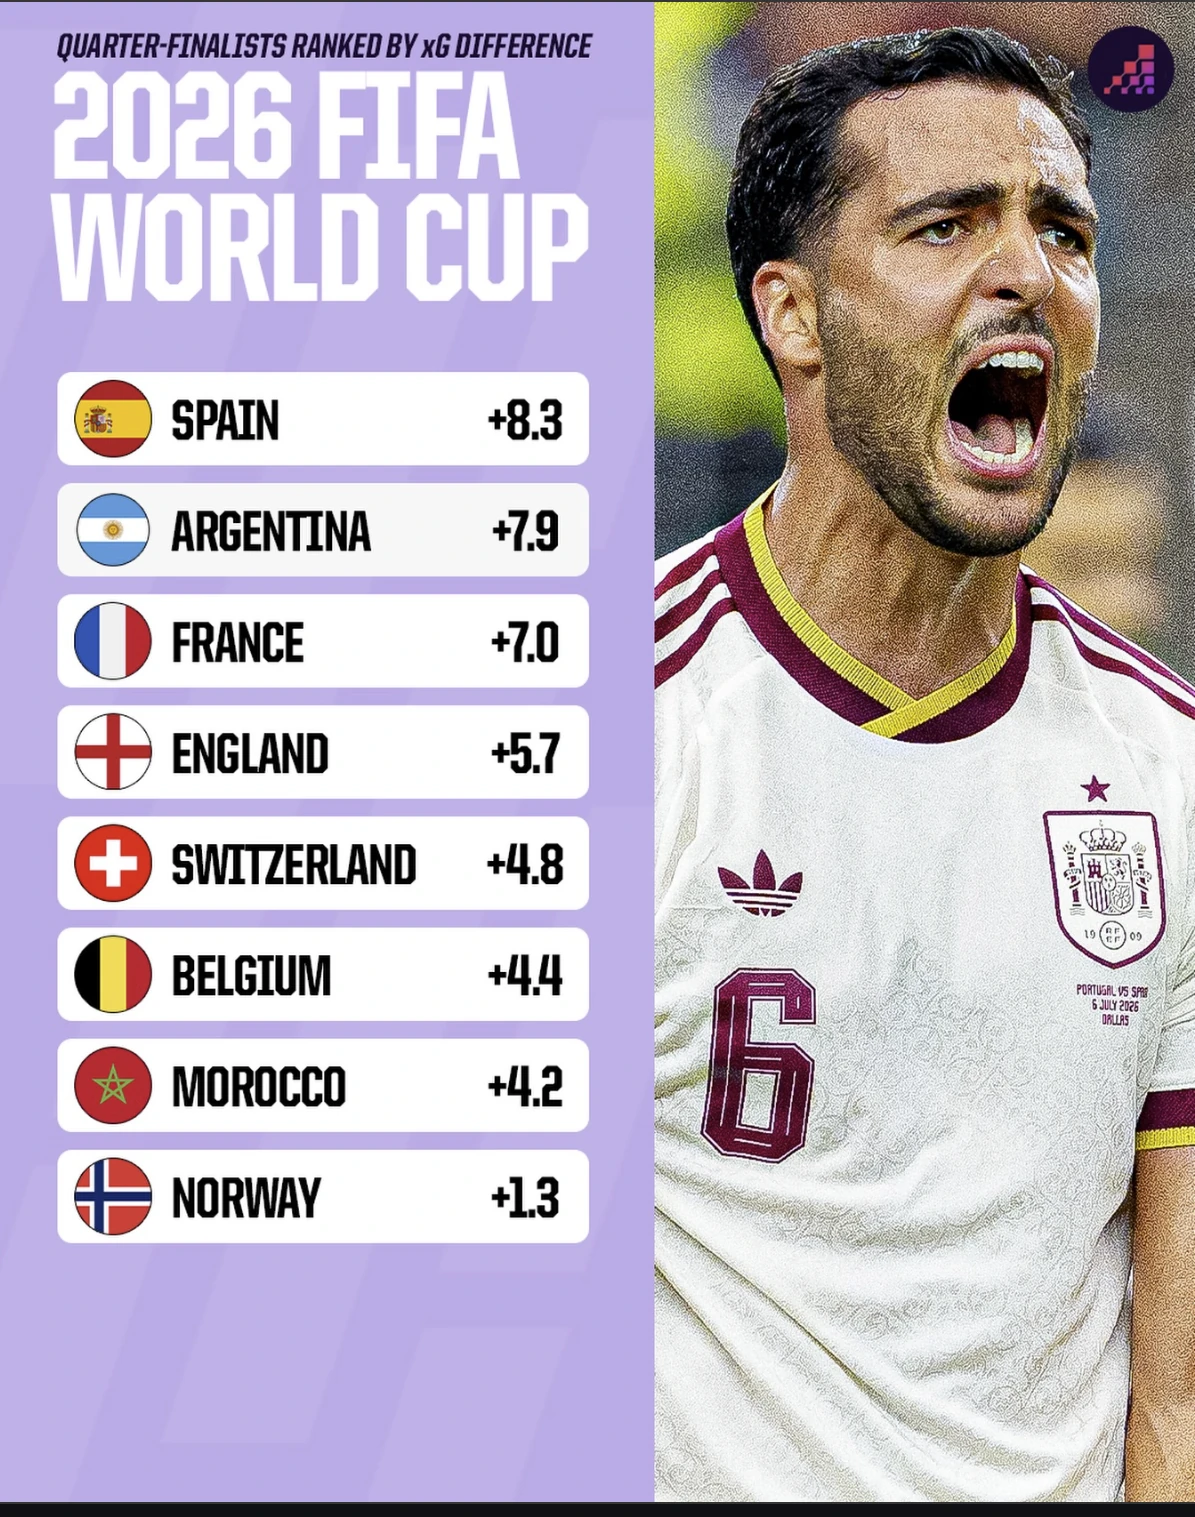
I want to take some time and write a quick blog explaining a new stat that I tinkered with and created that borrows from the concept one of the foundational analytics in football, that being XG.
What Is xG?
xG is a statistical measure of a shot as it relates to its goal.
Given the skill of an average player, how good of a goal opportunity was a shot?
It strips away the luck and skill differentiation and focuses on the process of the shot in isolation.
Put concretely, every shot is given a quality grade between 0 and 1, with 1 representing a guaranteed goal. If a shot is graded with an xG of 0.10, that means over 100 times it would be statistically expected to be a goal 10 times (1/10). For added reference, a penalty kick typically has an xG of about 0.79.
It is calculated from hundreds of thousands of shots, using factors such as:
- Distance and angle to the goal
- The type of pass that led to the shot
- The body part that used a shot
- Defender proximity
- Goalkeeper positioning
- And so forth
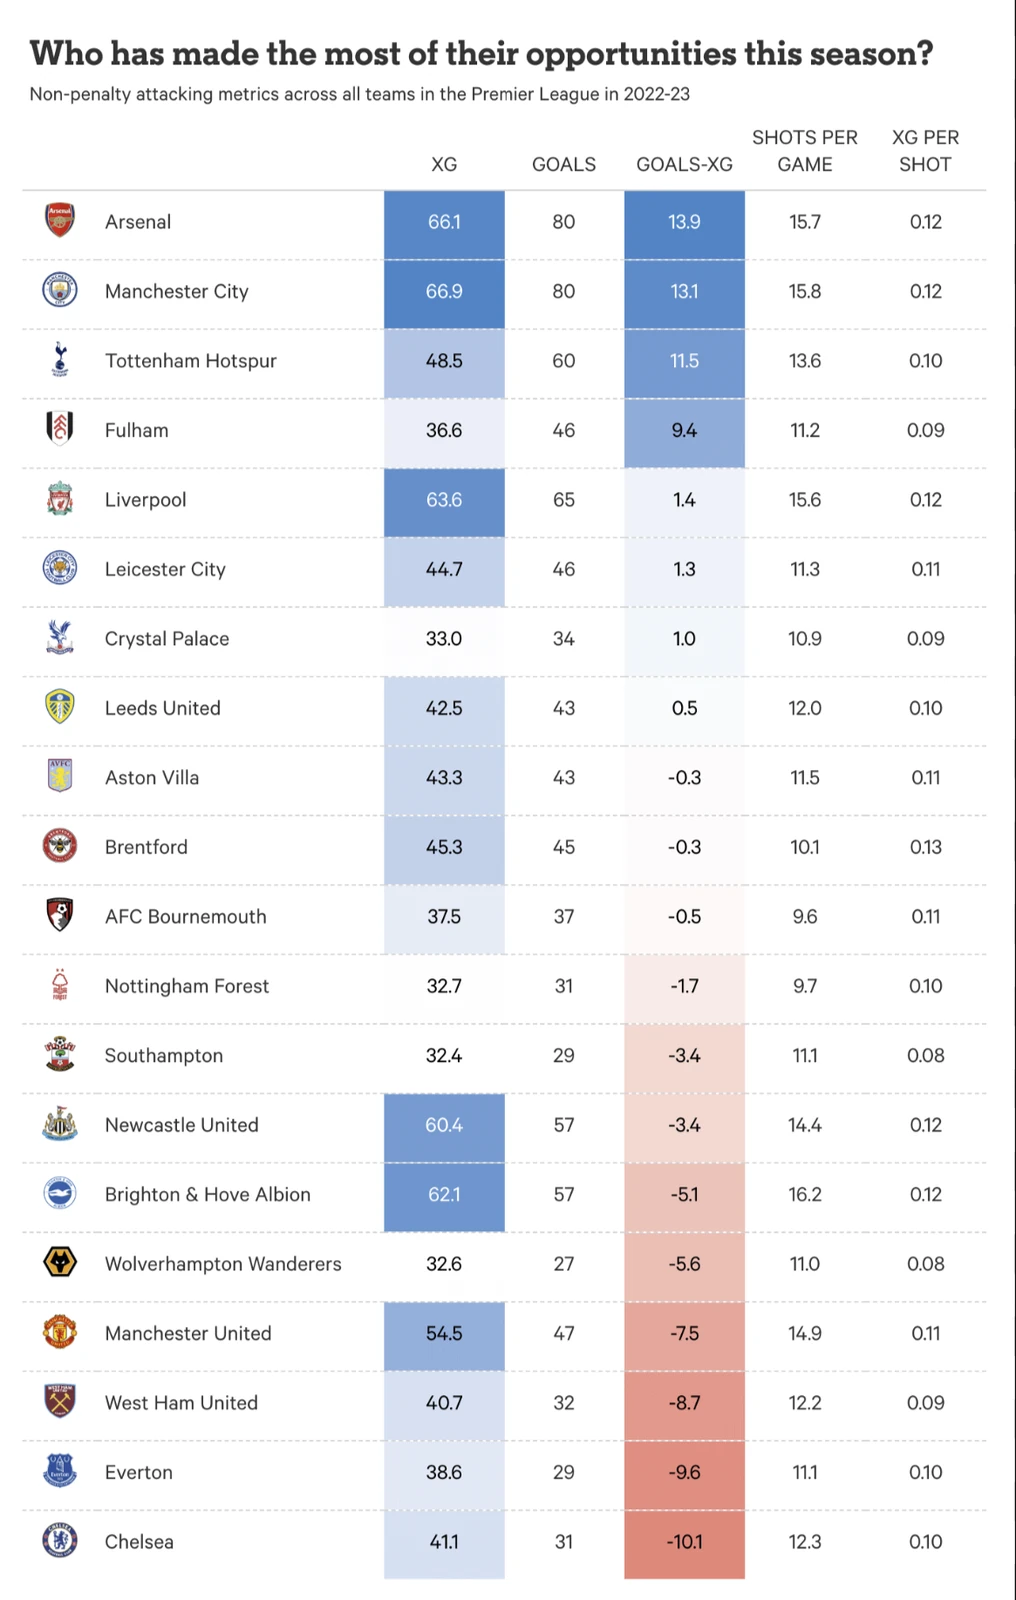
What makes xG so intriguing to me is that, over a long enough sample size, teams that lead in xG win proportionally — it's a beautiful proxy for process over results. Over a single season the correlation is considerably less, only around 48%, and that's exactly where the differences in luck and skill of conversion show up. (more on this later)
XG is also extremely versatile in the context it provides and the stories you can tell with it. You can use XG on a team level over the course of a season or seasons to see their relative strength and performance.
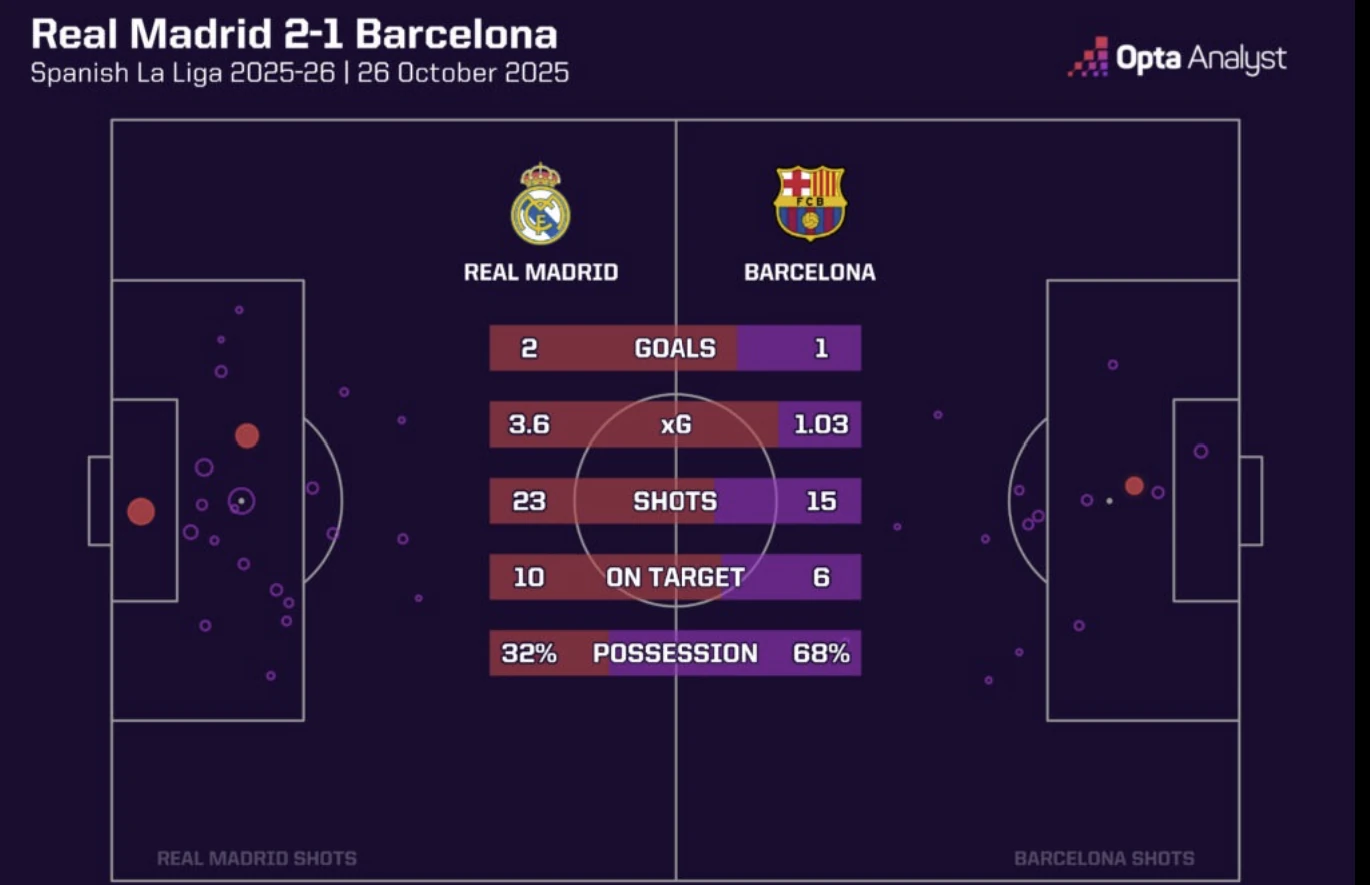
You can constantly see XG tables right next to the actual league tables and see the differences between actual performance and expected performance. You can also do it between teams on a game-by-game level to see whether a team should have "won" a game, or to better ascertain the approximate game state.
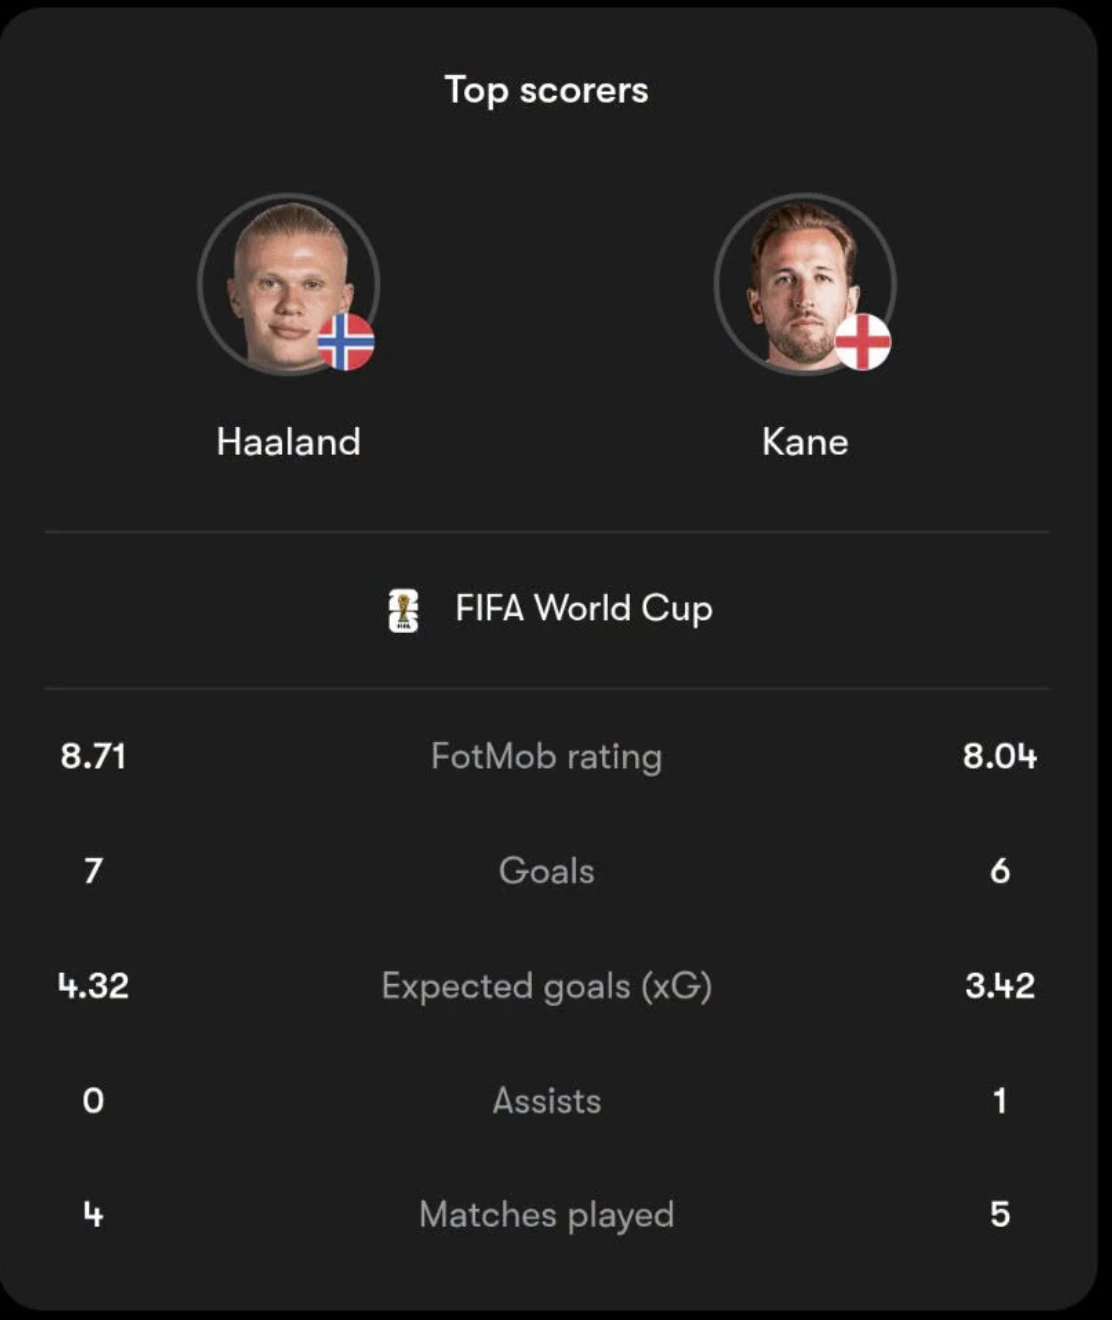
And Even cooler, you can do it on a player-by-player basis: to see how much better or worse a player's finishing was compared to the league average.
A player such as Harry Kane, who has been playing extremely well in this World Cup, consistently overperforms as xG while there are other players who underperform. A lot of nuance can come with this too, as even the ability to rack up xG both on a player and team level is a testament to at least their chance creation.
Watching this World Cup reminded me of a conversation I had with my best friend from when we were watching the Man U game about how cool it would be to bring the concept of XG to basketball. I spent a week-ish tinkering with models and created XPTS my my iteration of basketball version of XG What is XPTS xPTS are the expected points of a field goal attempt compared to league average.
xPTS grades every field goal attempt on a scale from 0 to 3, based on how many points that shot would be expected to produce if taken by an average NBA player. (though in practice no shot exceeds ~2) It completely strips out luck and individual conversion skill, aiming only to quantify the quality of shots. . A proper XPTS formula uses a granular location shot chart, in which you divide the basketball court into different shot zones, as well as defender distance data. The level of contest does have a tangible effect on shot quality
- The critical part of the x points formula is the bin. A bin is a specific shot type defined by four axes:Court zone: 14 zonesShot distance: 2-foot incrementsShot family: drive, cut, catch-and-shoot, self-created, alley-oop, or putbackPossession context: halfcourt, transition, second-chance, or off-turnovercodified approximately 707 populated bins per season across roughly 219,000 field goal attempts. Why Bins Matter: Granular Comparison A transition driving layup at the rim is priced at 1.62 xPTS.The same driving layup in a halfcourt set is priced at 1.39 xPTS.17 percent diffence between the two
- the average bin looks like the following. Driving layup, center of the paint, 0–2 feet from the rim, halfcourt8,786 shotsPriced at 1.39 xPTSThere is no need for any other adjustment as the sample size over the 29 years makes the expected point value extremely stable. Though there are shot types and bins that encompass rare shots (such as a second-chance catch-and-shoot from the right wing, 22 to 24 ft. away from the rim) Rare-shot bin: Second-chance catch-and-shoot, right wing, 22–24 feet5 shotsRaw average of 1.99 points per attemptTwo lucky makes on five attempts make that raw price unreliable.The adjustment: The rare bin is bayesian shrunk toward its parent zone, which includes all shots from the same zone and distance regardless of shot family or possession context.Parent-zone sample: 1,135 shotsParent-zone average: 0.87 points per attemptThe formula combines 5 shots of raw data with 50 shots’ worth of the zone average.The final price becomes 0.97 xPTS instead of 1.99.though This adjustment affects very few actual shots:Bins with fewer than 50 attempts contain only 2.1% of all shots.95% of shots fall into bins with at least 100 attempts.The 2015–16 NBA season is the only season for which the complete xPTS formula can be calculated using all four inputs:Shot locationShot familyPossession contextActual defender distanceAs it is the only season with publicly available defender-distance data for individual shots, drawn from "leaked" SportVU tracking dataFor every other season, both before and after 2015–16, I use an approximated version of xPTS that prices shots using the aformentioned location, shot family, and possession context, but wihotut defender distance.This approximated version is essentally a shot location router and captures roughly 77% of the accuracy estbalished by the full formula. The Final Product XPTS is an addtive and decomposable measure of shot quality You can compare players, sum a team’s total, or divide the value into points scored and points created, much like a striker’s xG accumulates across a season.Though novel in its XPTS is not the first attempt at quantifying NBA shot quality. EPV (Expected Possession Value) was created by Daniel Cervone, Alex D’Amour, Luke Bornn, and Kirk Goldsberry in 2014. It is a full-possession simulator that prices every moment of a possession in terms of expected points: sprints, passes, screens, dribbles, shots, and everything in between.It is a very beautiful creation, but it requires proprietary SportVU tracking data, including player and ball coordinates captured at 25 frames per second, which the league stopped making public after 2016. It is extremely closed-source.EPV is also not shot-level. It values the entire possession as a flowing chain, so you cannot isolate “this shot was worth X” the way xG or xPTS does. It also cannot be decomposed into scored versus created.
qSQ (Quantified Shot Quality) developed by Second Spectrum is the most similar to xPTS in spirit because it grades each shot based on what a league-average shooter would be expected to do with it.
qSQ uses actual defender distance on every shot, along with shooter velocity and the positions of the closest and next-closest defenders. It is the gold standard for shot quality and is also entirely proprietary. No one outside the league can see the model, the data, or the outputs. It produces a probability, expressed as expected eFG%, rather than an additive points currency, so it cannot be summed into a season total or decomposed as Xpts.
- EPAA (Expected Points Above Average) was developed by Williams, Schliep, Fosdick, and Elmore and published as an academic paper in 2024. It uses Bayesian hierarchical modeling to evaluate shooters relative to league average while adjusting for shot difficulty. It is a rigorous academic contribution, but it is a player-ranking tool rather than a scoring currency. You cannot sum it into a team total or divide it into scored and created value. It also does not include defender distance.
xPTS is an extremely versatile statistic that, when done properly, can be used to quantify the process of an NBA offense an defense, both on a granular player and team level. It also gives insight into the atomic root of value creation in the sport, that being conversion. In soccer, football, chance creation over a long enough time horizon is the game over a long enough sample size. The teams that create the most chances are the teams that win in a nearly proportional manner: chance creation (xG) explains roughly 75-80% of the variance in final standings while In basketball, chance creation (xPTS) explains only 33%.