Brief Introduction of PRISM
Introducing PRISM, an open research initiative to measure NBA player impact by blending possession-level production value with regularized adjusted plus-minus
Begin:
The Production-Regularized Impact Statistical Model (P.R.I.S.M) is an open, community-driven research initiative to quantify NBA player impact by blending regularized adjusted plus-minus (RAPM) with a possession-level valuation of box production, expressed as expected points added per 100 possessions. In other words I take a player's on/off impact and blend it with an itemized valuation of their production, where each action carries the expected-point value.
It exists to contribute an answer to a long-standing question in the NBA analytics community:
How much is a player actually worth, granularly — possession by possession?
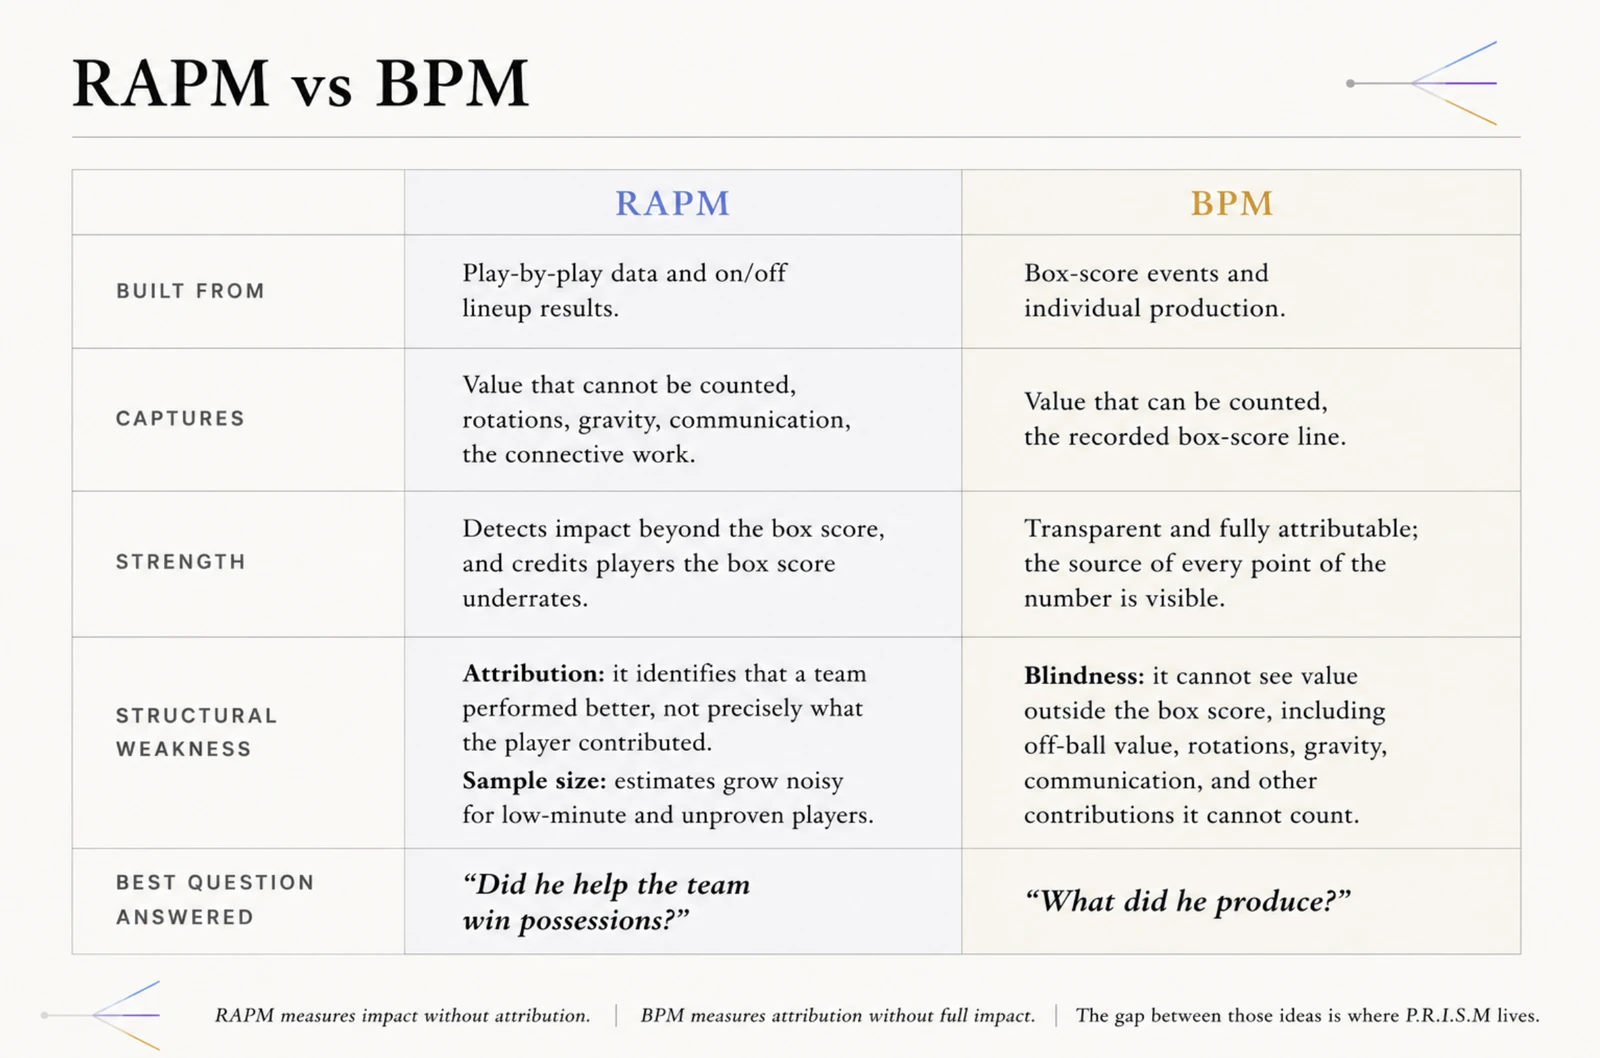
The community is already rich with excellent metrics and benchmarks, each with its own angle and its own answer to the question. I have personally been deeply engrossed in this space over the past several months, and two metrics stand as the grandfathers of it: RAPM and BPM.
RAPM strips away the noise of the box score, working from play-by-play to measure a team's value per possession with a player on the floor. It captures the beautiful intangibles, defensive rotations, communication, leadership, connective passing, that the box score and BPM can never capture.
Box plus-minus works by starting from the box score and moving in the opposite direction. It takes a player's recorded production, points, rebounds, assists, steals, blocks, and turnovers, and runs it through coefficients tuned to approximate per-100-possession impact relative to league average.
The Two Pillars of Player Impact
With RAPM and BPM as the two pillars, the intuition is that a more comprehensive answer lies in the blend of both.
Once again, the amazing community has known this and worked toward it for years. It is how we have gotten RPM and EPM, DARKO and LEBRON. All of these metrics, at their core, attempt to answer the question from that middle ground by compositing a box-score number and an on-off number into one.
PRISM's contribution is proposing a different way to build the box-score part of it, and the novelty is in the unique details of the blend itself.
The on-off component sits in the same regularized adjusted plus-minus tradition as most of the models. But most box-score components are predictive: they take a player's box-score line and fit it to forecast and predict plus-minus.
Measuring added value per possession: PRISM Box
PRISM, instead of trying to predict on-off impact from the box score, uses it to describe the tangible, numerical value a player adds each and every possession. It is EPA-adjacent, but it deviates from the box-score components just described.
PRISM Box takes the average value of an NBA possession and decomposes it into the box-score actions that make up that value.
Each of the following action:
- two-point shots
- three-point shots
- free throws
- steals
- blocks
- offensive and defensive rebounds
- assists
- turnovers
is assigned a weighted value drawn from what it is actually worth on the floor, summed into a single number per 100 possessions.
PRISM Box answers a single question against that baseline:
For every 100 possessions you are on the court, what are you tangibly contributing?
I ran in-depth play-by-play analysis across more than 200,000 plays and 140,000 individual events, until the values converged, calculating that the average NBA possession in 2026 was worth about 1.18 points, as well as the downstream value of every box action relative to that baseline.
A steal is notoriously one of the most underrated actions in basketball. Not only does it send the opposing possession to 0, it presents the stealing team oftentimes with an advantageous possession, and thus has been found to be worth around 1.54 points (full writeup on the value of a steal coming soon), and so forth.
I then took his box-score production per 100 possessions, priced each action at its expected-point value, added everything together, and then set the result against league average.
The scale is centered so that 0 represents an average player, and every point above or below zero reflects how much more, or less, value that player produced per 100 possessions.
PRISM Box vs Box+ ( how much does a missed shot cost?)
PRISM Box and PRISM Box+ answer different questions:
- Box = gross production value from box-score actions
- Box+ = net possession-value production, where empty scoring possessions matter
PRISM Box was my first attempt at the second question. As previously described, it is a deceptively simple metric. There is no regression, no linear fitting. At its atomic level it is fundamentally a summation. The stat doesn't capture the nuances between scaling and usage. It does not punish inefficiency of actions while on the floor.
For example, if two players score the same number of points per 100 possessions, but one does so more efficiently, their PRISM Box was identical.
Likewise, all else being equal, a player who scores roughly twice as many points as another player will produce a higher Box value, even if the additional volume comes with diminishing efficiency. The same applied to steals, rebounds, assists, and so on.
This is probably the biggest obstacle in building this metric:
How do we properly weight scoring versus other possessions, such as a steal, which naturally causes a possession swing? Is a missed two-pointer or a missed three-pointer really worth a full possession charge?
That question led to the creation of PRISM Box+, which gets us closer to the original thesis of possession by possession:
How much are you adding to your team's point value possession by possession?
First version of Prism Box was too crude to answer it: I simply treated misses as zeroed-out possessions, counting misses as a full lost possession. As a result the leaderboard became poisoned by low usage and high efficiency big men.
No disrespect to you, Luke Kornet. Amazing chase-down block but you are not a top 10 player in this league.
Ignoring the fact that some misses lead to offensive rebounds and keep the play alive, and it ignores the fact that some shots are hard self-created attempts. Those are still inefficient outcomes, but they are not as damaging as a live-ball turnover. Which honestly posits another question,
how much latent value is there on a missed shot?
PRISM Box+ adds a modest miss penalty based on field-goal and free-throw misses, while keeping the rest of the box-event weights the same. so high volume scoring is not treated the same regardless of efficiency. I ran another round of pbp (play by play) simulations to get us closer to an answer, and ended up with a much better measure of possession-by-possession scoring value.
PRISM Box+ is still a work in progress, but will not be tuning it with the intent to cover gaps surrounding assisted versus unassisted scoring, shot difficulty, and self-creation, in the box metric. This box metric is meant to measure tangible production and possession-level value, not to fully solve every contextual question surrounding on-court value.
Those questions are more naturally absorbed by PRISM Impact.
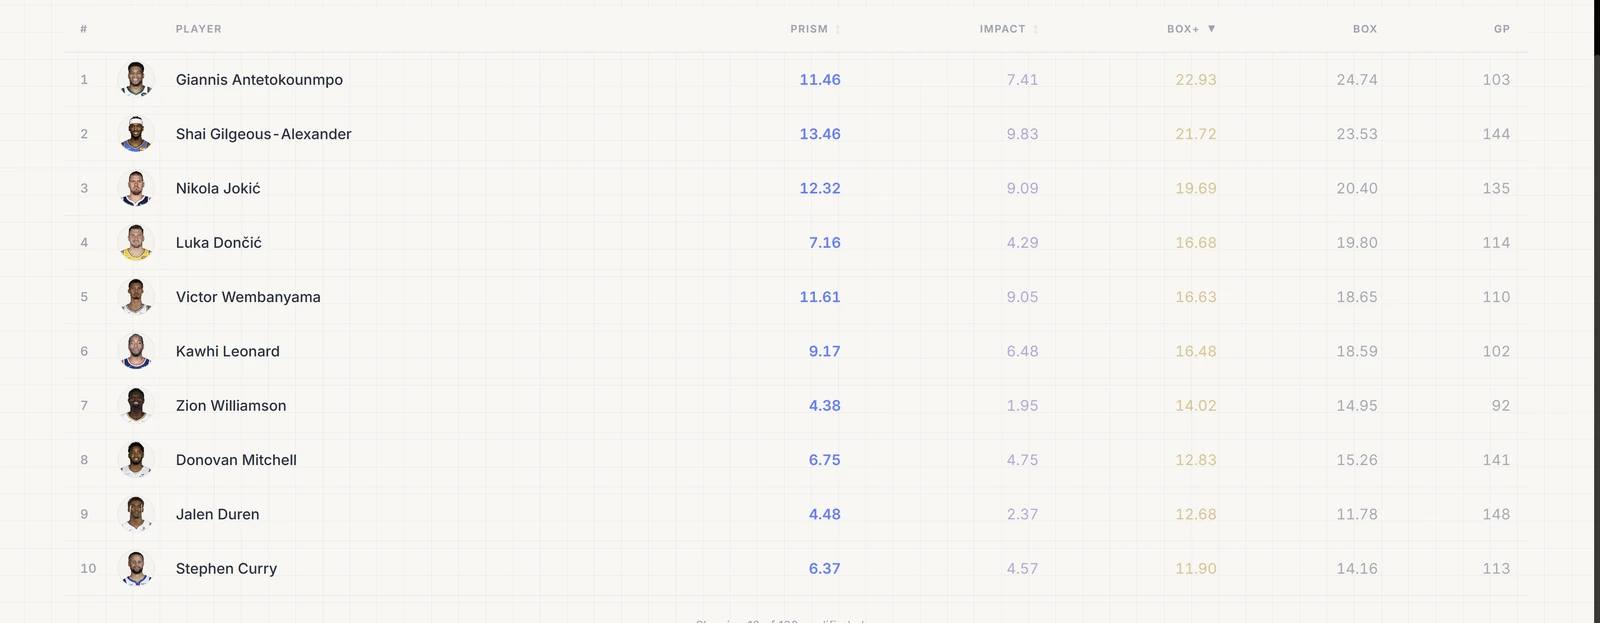
2025-26 Two-Year PRISM Box+ (minimum 70 GP across both seasons)
PRISM Impact
Prism Impact measures how much better a team performs, per 100 possessions, when a given player is on the floor, after accounting for both teammates and opponent quality. It is a regularized adjusted plus-minus, built from possession-level stints reconstructed from play-by-play, and stabilized with a box-score prior.
Impact metrics like PRISM Impact are incredibly valuable because they account for the intricate, nuanced intangibles of the game (e.g., screens, sets, communication, leadership, on-ball or off-ball defense, and rim protection that doesn't end in a block or steal). Answering the question of how much any given player's presence on the court, outside of production, swings the team's point value.
Methodology
Like other proper implementations of RAPM, PRISM Impact was constructed from possession-level stints.
Rather than relying on pre-aggregated lineup data, I went through thousands of plays reconstructing the lineups and substitutions one by one from the raw play-by-play, rebuilding every stint from the ground up.
(*Each unbroken stretch with the same 10 players on the floor is a stint. A single game breaks down into roughly 30 of them.*)
For each stint, recorded was:
- the players on both sides
- the possession count
- the scoring margin over that stretch
then scaled to a per-100-possession basis ran a ridge regression across all of those reconstructed stints to estimate how much each player moved his team’s performance, independent of the teammates and opponents sharing the floor with him.
RAPMs do a beautiful job of capturing latent, intangible value, but still struggles with
- Attribution. When two players share a large number of minutes together, it becomes extremely difficult for the model to separate due credit.
- Opponent strength. This is the age-old question of substitutions and Impact. Starters tend to play other starters, and depending on rotation patterns, some players accumulate a disproportionate share of their minutes against the "less talented" second unit. Quietly skewing numbers relatively between players.
- Noise. Even with everything above accounted for, you need thousands upon thousands of plays before the estimate settles into a reliable confidence interval.
The contextual adjustments for PRISM Impact include:
- Teammate and opponent adjustment. Every player on the floor, on both teams, enters the same regression, so a player's estimate is isolated better form their teammates and netted against the opponents in front of him. The model solves for all of them at once.
- A box-score prior. Players with limited minutes are pulled toward a box-based expectation rather than a noisy on/off estimate, so a small sample cannot produce a wild result. Essentially, a player is held to that expectation until there is enough evidence to prove otherwise.
- A multi-year window. in the instances where PRISM Impact is used as a sole metric, uses a canonical three-year window, to help with teammate separation and provide thousands of additional sample stints
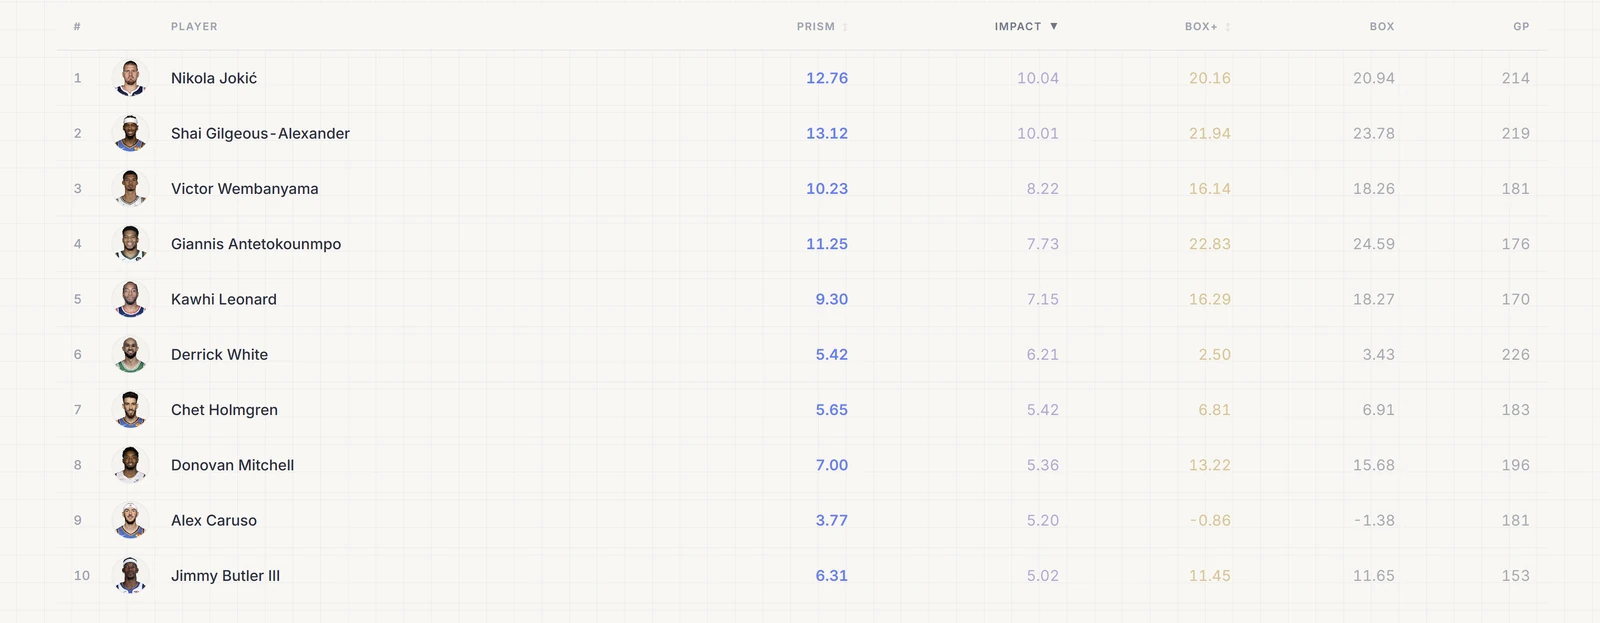
2025-26 Three-Year PRISM Impact (minimum 70 GP across both seasons)
PRISM - The Blend - How should on court value be illustrated?
To summarize:
- PRISM Impact measures the point differential of when you are on the floor, including the intangible and latent value the box score cannot functionally capture.
- PRISM Box+ is what you, as an individual player, tangibly create on a possession-by-possession basis.
The philosophical foundation of PRISM was to better illustrate the best individual players in the league, by marrying together the two dominant ways value is calculated.
For all the latent value a player can provide, box metrics are the box metrics for a reason, even if incomplete. Oftentimes they are the most valuable actions one can provide on a possession-by-possession basis. And oftentimes the best players in the league carry both: the impact and the more tangible load possession by possession.
PRISM is derived by blending Box+ and Impact, weighted more heavily toward a player's impact score allowing Box+ to serve as an foundational floor for possession-by-possession value
It is a descriptive metric aims to numerically describe a player's impact in a given season, rather than predict or forecast
Below is the top 10 of the 2026 2 yr PRISM Metric, where you can also see the calculated Prism Box, Box+, and Impact. Full 2yr, 3yr, 4yr, and 5yr leaderboards from 2015-16 through 2025-26 can be found at court-share.com/prism/leaderboard
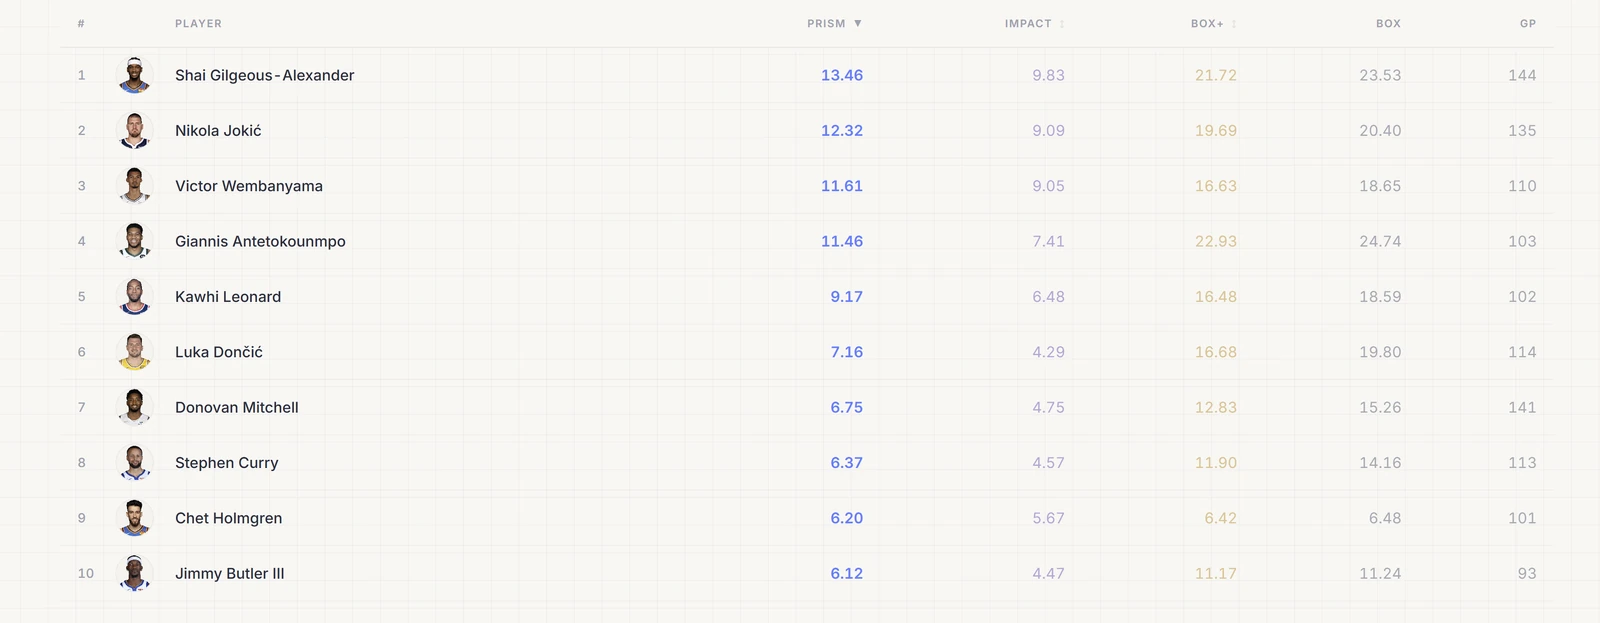
2025-26 Two-Year PRISM (minimum 70 GP across both seasons)
Whats Next
All metrics are in Version 1.0. And are actively being iterated upon and fine tuned.
Really enjoyed diving into this sitting down to reflect on my own views of player value, learn about the intricacies of contemporary methods for quantifying player impact, and put my own creative spin.
The plan for PRISM is to become fully open-source and widely usable. PRISM will serve as the home for my advanced basketball statistics work, and hopefully the work of others as well.
Have plans for:
- Finetuning PRISM
- A college version of PRISM and its derivatives, adapted for the unique challenges of evaluating college basketball.
- PRISM Efficiency, to find the most efficient players at varying usage rates
- A predictive PRISM model to identify future "stars" from a handful of early-career indicators.
If you're interested in contributing, and joining the NBA PRISM research team or just want to follow the project, reach out to me on X
The full methodology and statistics can be found at courtshare.com/prism.
References and Acknowledgments
Once again, a lot of great work exists. I wouldn't be able to dive in to the depth I did without the prior work of the following.
- DataBallr / NBA RAPM — https://databallr.com/six-factor-rapm
- DunksAndThrees / EPM — https://dunksandthrees.com/epm
- DARKO / Kostya Medvedovsky — https://apanalytics.shinyapps.io/DARKO/
- LEBRON / BBall Index — https://www.bball-index.com/lebron-introduction/
- Squared Statistics RAPM Deep Dive — https://squared2020.com/2017/09/18/deep-dive-on-regularized-adjusted-plus-minus-i-introductory-example/
- Basketball-Reference BPM Methodology — https://www.basketball-reference.com/about/bpm2.html
Fin: